Climate Solution Stocks
The most comprehensive list of climate solution stocks ever made
Filters:
| % ALLOCATED |
Company Type |
Company |
Category |
DESCRIPTION |
|---|---|---|---|---|
|
|
Critical Minerals
|
374Water, Inc.
|
Failed Market Cap Filter
|
We're keeping an eye on them, but as of last annual rebalance, they fell below our $250m market cap exclusion.
|
|
|
Biofuels
|
5E Advanced Materials Inc.
|
Failed Market Cap Filter
|
We're keeping an eye on them, but as of last annual rebalance, they fell below our $250m market cap exclusion.
|
|
0.0361%
|
Pure Play
|
8x8, Inc. provides voice, video, chat, contact center, business phones and cloud-based contact center solutions that enable people and businesses to avoid traveling for meetings.
|
||
|
|
Solar, PVs
|
%20Logo.jpg) A. O. Smith
|
Lacked Sufficient Information
|
AO Smith sells water heaters, boilers, and water treatment products, but not water leak detection solutions, so they donÕt contribute to any climate solutions.
|
|
1.0173%
|
Passed Revenue Filter
|
AAON sells geothermal/water-source heat pumps a key technology for making buildings electrified and more energy efficient.
|
||
|
0.9750%
|
Pure Play
|
Acuity makes LED lights for commercial, architectural, and specialty applications. Acuity also makes building efficiency and building automation products.
|
||
|
0.0796%
|
Pure Play
|
ADS-TEC Energy is an EV infrastructure pure play. ADS-TEC Energy's ChargeBox is a fast charging solution for EVs with up to 320 KW charging power.
|
||
|
|
Energy Storage
|
 Advent Technologies Holdings
|
Failed Market Cap Filter
|
Advent sells components that improve the performance of hydrogen fuel cells for the aviation, automotive, and other markets.
|
|
|
Hybrid Cars
|
 Aecom
|
Failed Revenue Filter
|
Aecom provides infrastructure consulting services for developing fuel cell, solar/wind infrastructure, and EV infrastructure, but these only account for 3% of its revenue.
|
|
|
Grid Expansion
|
%20Logo.jpg) Aemetis
|
Failed Biofuel Filter
|
Aemetic makes ethanol from corn or biomass (itÕs not clear which is more) and pipeline-quality renewable natural gas from dairy manure. Since most of its revenue comes from ethanol, which is not an advanced biofuel, it fails out biofuel filter.
|
|
|
Alternative Cement
|
.jpg) Agrify
|
Failed Market Cap Filter
|
Agrify sells LED grow lights amongst other business activities, but donÕt provide a revenue breakdown, thus are excluded for lack of sufficient information.
|
|
|
Critical Minerals
|
%20Logo.png) Albemarle Corporation
|
Failed Mining Filter
|
Albemarle makes lithium compounds that promote energy storage. But 55% of its revenue comes from chemical products for the oil and gas industry, so it fails our revenue filter.
|
|
|
Biomass
|
 Algoma Steel Group Inc.
|
Failed Revenue Filter
|
Algoma is a steel manufacturer. While they are constructing 2 state-of-the-art electric arc furnaces to replace its existing blast furnace steelmaking operations, as of 2022, they are not yet operational.
|
|
|
Electrical Utility
|
 Algonquin Power & Utilities.
|
Failed Utility Filter
|
Algonquin is an energy utility whose revenue mostly comes from transmission and distribution. Most of the electricity they transmit, however, is not from clean sources, so it fails our utility filter.
|
|
|
Electric Aviation
|
Alico, Inc.
|
Failed Market Cap Filter
|
We're keeping an eye on them, but as of last annual rebalance, they fell below our $250m market cap exclusion.
|
|
|
Perennial Staple Crops
|
 Allegro Microsystems
|
Failed Revenue Filter
|
Allegro makes LED driver integrated circuits with LED lighting application, but 69% of its revenue comes from selling products to the internal combustion engine automotive market, so it fails the revenue filter.
|
|
|
Electrical Utility
|
%20Logo.png) ALLETE
|
Failed Utility Filter
|
Allete is a holding company whose subsidiaries operate power plants. While one subsidiary owns wind farms, another Ð Minnesota Power Ð owns coal-fired units which it wonÕt retire until 2035. It fails our coal filter.
|
|
|
Electrical Utility
|
%20Logo.jpg) Alliant Energy
|
Failed Utility Filter
|
Alliant is an electric utility company that produce 70% of its power from fossil fuels, including coal. It fails our utility and coal filter.
|
|
|
LED
|
Allison Transmission Holdings, Inc.
|
Failed Defense Filter
|
Allison Transmissions sells electrified drivetrains for trucks, a key climate solution, but they also make multiple product lines such as defense vehicles for the military, meaning they fail our defense filter.
|
|
|
Energy Storage
|
Alternus Clean Energy Inc
|
Failed Market Cap Filter
|
We're keeping an eye on them, but as of last annual rebalance, they fell below our $250m market cap exclusion.
|
|
0.0722%
|
Pure Play
|
Altus Power is a clean electricity generation pure play. Because all of its revenue comes from clean electricity, we include it in the Climate Index.
|
||
|
|
Electrical Utility
|
%20Logo.png) Ameren
|
Lacked Sufficient Information
|
Ameren is a power utility. It donÕt provide enough information about its sources of power generation. We exclude Ameren for lack of sufficient information.
|
|
0.1498%
|
Pure Play
|
Ameresco makes buildings more energy efficient, builds renewable power plants, sells solar PV products, and owns a wind power project.
|
||
|
|
Solar, PVs
|
American Battery Technology Company
|
Failed Market Cap Filter
|
We're keeping an eye on them, but as of last annual rebalance, they fell below our $250m market cap exclusion.
|
|
|
Electrical Utility
|
%20Logo.jpg) American Electric Power
|
Failed Utility Filter
|
American Electric Power is a utility that produces 70% of its power from coal and natural gas, and the rest from clean sources. It fails our utility and coal filters.
|
|
|
Waste To Energy
|
American Lithium Corp.
|
Failed Market Cap Filter
|
We're keeping an eye on them, but as of last annual rebalance, they fell below our $250m market cap exclusion.
|
|
|
Solar, PVs
|
Amprius Technologies, Inc.
|
Failed Market Cap Filter
|
We're keeping an eye on them, but as of last annual rebalance, they fell below our $250m market cap exclusion.
|
|
|
LED
|
.png) Amtech Systems
|
Failed Market Cap Filter
|
Amtech makes semiconductor equipment with a wide range of applications, including LEDs. But itÕs not clear how much of its revenue comes from LED lighting. We exclude them for lack of sufficient information.
|
|
0.1597%
|
Passed Revenue Filter
|
Apogee makes high-performance glass and related products that enhance the energy efficiency of buildings.
|
||
|
|
LED
|
.jpg) Aqua Metals
|
Failed Market Cap Filter
|
Aqua recycles lead that is primarily used in lead acid batteries, which promotes the circular economy
|
|
|
Recycled Metals
|
Arcadia Biosciences, Inc.
|
Failed Market Cap Filter
|
We're keeping an eye on them, but as of last annual rebalance, they fell below our $250m market cap exclusion.
|
|
|
Pure Play
|
Arcadium Lithium (Formerly Livent) is a pure play that sells lithium compounds, primarily used in lithium batteries, a key component in EV's and battery storage of electricity.
|
||
|
0.4983%
|
Pure Play
|
Archer Aviation is an electric aviation pure play that is designing an electric aircraft for use in future urban air mobility networks and reduce the need for fossil-fuel powered air transport.
|
||
|
|
Wind Power
|
%20Logo.png) Arcosa
|
Failed Revenue Filter
|
Arcosa builds structural wind towers in the US and Mexico, but they also sell a range of products to the fossil fuel industry. Since Arcosa donÕt provide a revenue breakdown between these segments, we exclude it for lack of sufficient information
|
|
|
Electric Cars
|
%20Logo.png) Argan
|
Failed Revenue Filter
|
ArganÕs subsidiary Gemma offers clean power generation but also fossil fuel-based power plant. Its gas-fired power plant is much bigger than its clean power generation.
|
|
0.1032%
|
Pure Play
|
Array sells solar tracking systems that use machine learning to identify the best positioning for a solar array to increase energy production.
|
||
|
|
Critical Minerals
|
Ascent Solar Technologies, Inc.
|
Failed Market Cap Filter
|
We're keeping an eye on them, but as of last annual rebalance, they fell below our $250m market cap exclusion.
|
|
|
Insulation
|
ASP Isotopes Inc.
|
Lacked Sufficient Information
|
ASP Isotopes refined uranium, but for a variety of uses including medical. Given their lack of breakdown, we not include them.
|
|
|
Water Distribution
|
 Aspen Aerogels, Inc.
|
Lacked Sufficient Information
|
Aspen Aerogels make aerogel materials used in the energy infrastructure, building materials and EV markets. But its main end-markets are fossil fuel plants, thus failing the revenue filter.
|
|
|
Critical Minerals
|
%20Logo.png) Atlantic Power
|
Failed Utility Filter
|
Atlantic produces 70% of its power from fossil fuels, so it fails our utility filter. In 2021, it was acquired by I Squared Capital.
|
|
0.2614%
|
Passed Revenue Filter
|
Stem helps buildings to switch from onsite, to stored, to grid electricity with an AI-powered platform.
|
||
|
|
Net-Zero Building
|
Atlas Lithium Corporation
|
Failed Market Cap Filter
|
We're keeping an eye on them, but as of last annual rebalance, they fell below our $250m market cap exclusion.
|
|
|
Solar, PVs
|
 Atlas Technical Consultants
|
Failed Revenue Filter
|
Atlas Technical makes water leak detection and repair solutions, but it doesnÕt provide a revenue breakdown. ItÕs likely that these Climate solutions are less than 50% of its total revenue. We exclude them for lack of sufficient information.
|
|
0.0609%
|
Pure Play
|
ATRenew is a platform where pre-owned consumer electronics (mostly mobile phones) are bought and sold. This is a pure play that contributes to the climate solution of recycling.
|
||
|
0.0315%
|
Pure Play
|
AudioCode sells software and productivity solutions for virtual work environments, enabling people to collaborate without the need of physical travel.
|
||
|
|
Critical Minerals
|
 Austin Gold Corp.
|
Failed Mining Filter
|
Austin Gold Corp., a gold exploration company, focuses on the exploration of mineral property interests in Nevada. It is pre-revenue but since its focus is gold, a non-critical mineral, it is excluded
|
|
|
SmartGrid
|
.jpg) Avangrid
|
Failed Utility Filter
|
Avangrid is an energy utility that generates mostly renewable energy. However most of its revenue comes from tramission of eletricity with aproximately half of that being clean. In addition ~20% of its revenue from the sale of natural gas.
|
|
|
Electrical Utility
|
%20Logo.png) Avista
|
Failed Utility Filter
|
Avista is an electric utility that produces most of its power from clean sources. But 13% of its power comes from coal with no plans for its retirement in the next 3 years. It fails our coal filter.
|
|
|
LED
|
.png) AXT
|
Failed Market Cap Filter
|
AXT makes semiconductor substrates used in LEDs, thermal imaging, and autonomous vehicles. They donÕt give a precise revenue breakdown, so we exclude them for lack of sufficient information.
|
|
|
Electric Two Wheelers
|
.jpg) Ayro
|
Failed Market Cap Filter
|
Ayro is a pure play in EVs for last-mile delivery, which can access tight areas like university paths and business parks.
|
|
|
Waste to Energy
|
%20Logo.jpg) Babcock & Wilcox Enterprises
|
Failed Revenue Filter
|
Babcock & Wilcox makes waste-to-energy and biomass solutions. It also offers carbon capture technologies but without storage, which we consider fossil fuel revenue. Its largest revenue source is products for the oil & gas sectors, failing our revenue filter.
|
|
0.6423%
|
Passed Revenue Filter
|
Badger makes >50% of its revenue from selling water meters that can help water utilities detect leaks, an important climate solution.
|
||
|
|
Critical Minerals
|
Baijiayun Group Ltd
|
Failed Market Cap Filter
|
We're keeping an eye on them, but as of last annual rebalance, they fell below our $250m market cap exclusion.
|
|
0.0606%
|
Pure Play
|
Ballard sells proton exchange membrane fuel cells to transit but, rail, and critical infrastructure industries that can enable them to run without carbon emissions
|
||
|
|
Electrical Utility
|
Beacon Roofing Supply
|
Failed Revenue Filter
|
Beacon sells and distributes insulation products, solar paneling, solar inverters and solar panels mounting hardware.
|
|
|
Electric Cars
|
.png) Beam Global
|
Failed Market Cap Filter
|
Beam Global sells EV charging solutions that use solar power and battery storage to power themselves.
|
|
|
Solar, PVs
|
Benson Hill, Inc.
|
Failed Market Cap Filter
|
We're keeping an eye on them, but as of last annual rebalance, they fell below our $250m market cap exclusion.
|
|
0.0261%
|
Pure Play
|
Beyond Meat sells various plant-based meat products that reduce the demand for traditional animal-based meat.
|
||
|
|
EV Infrastructure
|
.jpg) Blink Charging
|
Failed Market Cap Filter
|
Blink operates a wide network of EV charging stations.
|
|
|
Hybrid Cars
|
%20Logo.jpg) Bloom Energy
|
Lacked Sufficient Information
|
Bloom EnergyÕs energy servers can operate on both hydrogen and biogas, but most of them use natural gas as its fuel. We consider this fossil fuel revenue.
|
|
|
Bioplastics
|
Blue Bird Corporation
|
Failed Revenue Filter
|
Blue Bird manufactures school buses. Although they are a leader in electric school buses, it still falls below 50% of their revenue.
|
|
|
Critical Minerals
|
Borealis Foods Inc.
|
Failed Market Cap Filter
|
We're keeping an eye on them, but as of last annual rebalance, they fell below our $250m market cap exclusion.
|
|
|
Electric Cars
|
%20Logo.png) BorgWarner
|
Failed Revenue Filter
|
BorgWarner makes some solutions for EVs but makes a much larger portion of its revenue from traditional internal combustion vehicles. It fails our revenue filter.
|
|
|
Electric Two Wheelers
|
BranchOut Food Inc.
|
Failed Market Cap Filter
|
We're keeping an eye on them, but as of last annual rebalance, they fell below our $250m market cap exclusion.
|
|
|
Ocean Power
|
 Brenmiller Energy Ltd
|
Failed Market Cap Filter
|
Brenmiller makes heat battery based on natural crushed rocks, but were excluded because it has been on the market for less than 6 months
|
|
|
Telepresence
|
.png) Broadwind
|
Failed Market Cap Filter
|
Broadwind makes 70% of its revenue by selling steel towers and adapters to wind turbine manufacturers.
|
|
|
Electrical Utility
|
%20Logo.png) Brookfield Infrastructure Partners L.P.
|
Lacked Sufficient Information
|
Belden sells basic connectivity solutions for energy and telecom, but it doesnÕt make products designed to strengthen and expand the electrical grid. It therefore donÕt offer any climate solutions.
|
|
0.5332%
|
Pure Play
|
Brookfield is an yieldco that is focused on generating electricity from renewable energy assets. 100% of its revenue comes from generating renewable power.
|
||
|
|
Smart Thermostat
|
%20Logo.png) BWX Technologies
|
Failed Defense Filter
|
BWX performs fabrication activities for missile launch tubes for US submarines, which fail our defense filter.
|
|
2.4411%
|
Pure Play
|
Cameco mines and sells uranium for the purposes of nuclear fuel production.
|
||
|
0.0836%
|
Pure Play
|
Canadian Solar sells solar ingots, wafers, cells, modules, panels and other solar power products as well as battery storage products.
|
||
|
|
Electric Cars
|
 Canoo
|
Failed Market Cap Filter
|
Canoo is a pure play that makes electric delivery and multi-purpose vehicles, including an electric skateboard.
|
|
|
Electric Cars
|
%20Logo.jpg) Carlisle Companies
|
Lacked Sufficient Information
|
Carlisle makes building products, including building envelope products and energy-efficiency solutions. But it also sells high-performance wire and cable, with in-flight connectivity applications for military aircrafts. It therefore fails our defense filter.
|
|
5.0000%
|
Passed Revenue Filter
|
Carrier sells HVAC products including high-efficiency heat pumps, a technology necessary for electrifying and energy retrofitting buildings.
|
||
|
|
LED
|
.png) Casella Waste Systems
|
Failed Landfill Filter
|
Casella is a waste management company that gets some of its revenue from recycling, a climate solution. But it also owns 9 landfill sites, and only 4 of them currently have gas-to-energy facilities. It therefore fails our landfill filter.
|
|
|
Biomass
|
.jpg) CBAK Energy Technology
|
Failed Market Cap Filter
|
CBAK is a pure play that makes lithium batteries used in EVs, electric tools, and energy storage applications.
|
|
|
Mass Transit
|
 Cenntro Electric Group Limited
|
Failed Market Cap Filter
|
Cenntro Electric is a EV pure play that makes light- and medium-duty electric commercial vehicles.
|
|
|
Electrical Utility
|
%20Logo.png) CenterPoint Energy
|
Failed Utility Filter
|
CenterPoint is an electric utility that produces most of its power from fossil fuels, including coal. It fails our utility and coal filters.
|
|
|
Electrical Utility
|
 Centrais Elétricas Brasileiras - Eletrobrás
|
Failed Utility Filter
|
EBR is an electric utility that produces 85.3% of its power from clean sources. But it also produces some of its power from coal and it has no plans to shut down its coal plants within the next 3 years, failing our coal filter.
|
|
|
Electrical Utility
|
%20Logo.png) Central Puerto
|
Failed Utility Filter
|
Central Puerto produces 61.5% of its power from fossil fuels (gas) and the rest from renewables (hydro and wind). It, therefore donÕt pass our utility filter.
|
|
0.1369%
|
Pure Play
|
Centrus sells various components of nuclear fuel and provides technical services to deploy advanced nuclear fuel production capabilities.
|
||
|
0.0543%
|
Pure Play
|
ChargePoint sells EV charging solutions like smart charging stations, which can be used by fleets or individual owners.
|
||
|
|
Electric Two Wheelers
|
Chijet Motor Company, Inc.
|
Failed Market Cap Filter
|
We're keeping an eye on them, but as of last annual rebalance, they fell below our $250m market cap exclusion.
|
|
|
Water Distribution
|
%20Logo.png) China Recycling Energy
|
Failed Revenue Filter
|
China Recycling Energy conducts waste-to-energy operations, but uses gas from coal mining, oil exploitation, refining processing and other fossil fuels as a fuel source. It therefore fails our revenue filter.
|
|
|
Telepresence
|
 Cisco
|
Failed Telepresence Filter
|
Cisco is a technology conglomerate that sells hardware, software and other high-tech services and products. They offer telepresence solutions, but it makes up less than 50% of its revenue, so we exclude them.
|
|
0.0688%
|
Passed Revenue Filter
|
Clean Energy Group generates almost all of its revenue from the collection, refinement, and sale of renewable natural gas into a drop-in replacement for diesel fuels. This is one of the only transition fuels available to reduce emissions in heavy trucking and is a critical transitional technology.
|
||
|
|
Energy Storage
|
Clean Energy Technologies, Inc.
|
Failed Market Cap Filter
|
We're keeping an eye on them, but as of last annual rebalance, they fell below our $250m market cap exclusion.
|
|
|
Critical Minerals
|
 Clean Harbors Inc
|
Failed Landfill Filter
|
Clean Harbors provides environmental and industrial services, including hazardous waste management and recycling. It owns 7 landfills but none have methane capture systems, so it fails the landfill filter.
|
|
|
Methane Capture
|
 CleanSpark
|
Failed Revenue Filter
|
CleanSpark sells distributed energy systems and microgirds, but the vast majority of its revenue comes from bitcoin mining which is not a Climate solution. It fails our revenue filter.
|
|
|
Solar, PVs
|
 ClearOne
|
Failed Market Cap Filter
|
ClearOne sells audio conferencing products and sound-reinforcement products that improve virtual connections and enable people to more easily collaborate without physical travel.
|
|
0.5305%
|
Passed Revenue Filter
|
Clearway Energy is an yieldco that's purely focused on generating clean electricity. 99.5% of the electricity it generates comes from renewables.
|
||
|
|
Electrical Utility
|
%20Logo.jpeg) CMS Energy
|
Failed Utility Filter
|
CMS is an electric utility that produces 79.2% of its power from fossil fuels, including coal. It fails our utility and coal filters.
|
|
|
Solar, PVs
|
%20Logo.png) CN Energy Group
|
Failed Market Cap Filter
|
CN Energy Group makes biomass electricity from wood. Due to its high emissions, Carbon Collective does not consider biomass electricity a Climate Solution and therefore exclude it.
|
|
|
Fuel Cells
|
 Comfort Systems USA
|
Lacked Sufficient Information
|
Comfort Systems makes 84.5% of its revenue from replacing old HVAC systems with more efficient ones.
|
|
0.5881%
|
Passed Revenue Filter
|
Commercial Metals manufactures steel and metal products, 98% of which is from recycled scrap metal, helping make steel a circular industry
|
||
|
|
Critical Minerals
|
Complete Solaria, Inc.
|
Failed Market Cap Filter
|
We're keeping an eye on them, but as of last annual rebalance, they fell below our $250m market cap exclusion.
|
|
|
Waste To Energy
|
Comstock Inc.
|
Failed Market Cap Filter
|
We're keeping an eye on them, but as of last annual rebalance, they fell below our $250m market cap exclusion.
|
|
|
EV Infrastructure
|
ConnectM Technology Solutions, Inc.
|
Failed Market Cap Filter
|
We're keeping an eye on them, but as of last annual rebalance, they fell below our $250m market cap exclusion.
|
|
|
Electrical Utility
|
%20Logo.png) Consolidated Edison
|
Failed Utility Filter
|
51.8% of the electricity Con Ed generates and just about half of the electricity they transmit is clean, meaning they fall well below the 100% threshold.
|
|
|
Electrical Utility
|
Constellation Energy Corporation
|
Failed Utility Filter
|
Constellation Energy is the largest owner of nuclear power plants in the US. While we generally do not consider utilities to be climate solutions, Constellation is engaged in developing new nuclear plants. But this does not constitute a majority of their revenue, so we do not yet include them.
|
|
|
Critical Minerals
|
.png) Contango Ore, Inc.
|
Failed Mining Filter
|
Contango Ore, Inc., a gold exploration company, focuses on the exploration of mineral property interests in Alaska. It is pre-revenue but since it focus is gold, a non-critical mineral, it is excluded
|
|
|
Recycled Metals
|
 Core & Main, Inc
|
Failed Revenue Filter
|
Core & Main sells smart meters and advanced metering technology that help reduce water loss through leak detection. But these account for only 8% of its revenue, so it fails the revenue filter.
|
|
|
Telepresence
|
%20Logo.jpg) Corning
|
No Drawdown Solution
|
Corning makes LED display products and emissions control products for the automotive industry, but not LED lighting, leaving it without a climate solution.
|
|
|
Heat Pumps
|
.png) CRH
|
Lacked Sufficient Information
|
CRH makes building materials, including high-performance glass, a climate solution. But most of its revenue comes from conventional cement, concrete and asphalt.
|
|
0.0614%
|
Passed Mining Filter
|
Critical Metals Corp is a pure play lithium mining company. Lithium is a key component for lithium ion batteries.
|
||
|
|
Fuel Cells
|
 Crown ElectroKinetics
|
Failed Market Cap Filter
|
Crown makes dynamic glass that changes its opacity and reflectiveness in response to outside conditions. Dynamic glass enhances the energy efficiency of buildings.
|
|
|
Microgrid
|
 CSW Industrials
|
Failed Revenue Filter
|
CSW makes 69% of its revenue from products that make heating and cooling systems more efficient.
|
|
|
Electric Cars
|
%20Logo.png) Cummins
|
Failed Revenue Filter
|
Cummins makes hydrogen production solutions, but 71% of its revenue comes from selling parts for internal combustion engine vehicles, and the oil and gas markets, so it fails our revenue filter.
|
|
|
LED
|
%20Logo.png) CVD Equipment
|
Failed Defense Filter
|
CVD is a specialty industrial machinery company. It offers MesoPlasma printing services and products to the defense industry, failing our defense filter.
|
|
|
Electric Cars
|
%20Logo.jpg) Dana Corporation
|
Lacked Sufficient Information
|
Dana sells both EV and internal combustion engine vehicle parts, but we exclude them because a revenue breakdown between those two segments is not provided.
|
|
0.1408%
|
Pure Play
|
Daqo core business is selling high-purity polysilicon used in solar PVs to PV manufacturers.
|
||
|
0.2731%
|
Pure Play
|
Gingko uses genetic engineering to product bacteria with industrial applications. It works in the food and agricultural markets, but donÕt offer Climate solutions.
|
||
|
|
Telepresence
|
 Digi International
|
Failed Telepresence Filter
|
Digi International sells embedded and external network communications as well as USB products. They are not a telepresence pure play, so theyÕre excluded from the Index.
|
|
|
Insulation
|
.png) Diodes
|
Failed Revenue Filter
|
Diodes sells discrete semiconductor products with consumer electronics industry applications. But it makes only small revenue from LED lighting applications, so it fails our revenue filter.
|
|
1.8844%
|
Pure Play
|
DocuSign provides an e-signature solution that allows for digital signing of agreements and documents, saving both paper and emissions from transportation
|
||
|
|
Electrical Utility
|
%20Logo.png) Dominion Energy
|
Failed Utility Filter
|
Dominion is an electric utility that generates about half of its power from fossil fuels, including coal. With no plans to retire its coal plants, it fails our coal filter.
|
|
|
Efficient Irrigation
|
%20Logo.png) Dow
|
Lacked Sufficient Information
|
Dow makes both traditional and bioplastics. We exclude it for lacking sufficient information that would help us determine which is a larger source of revenue.
|
|
|
Waste To Energy
|
Dragonfly Energy Holdings Corp.
|
Failed Market Cap Filter
|
We're keeping an eye on them, but as of last annual rebalance, they fell below our $250m market cap exclusion.
|
|
|
Electrical Utility
|
%20Logo.jpg) DTE Energy
|
Failed Utility Filter
|
DTE is an electric utility that produces 70.4% of its power from fossil fuels, failing our utility filter.
|
|
|
Electrical Utility
|
%20Logo.png) Duke Energy
|
Failed Utility Filter
|
Duke Energy is an electric utility that produces 74% of its power from fossil fuels, failing our utility filter.
|
|
|
Water Distribution
|
%20Logo.png) DuPont de Nemours
|
Lacked Sufficient Information
|
DuPont is a chemicals company. It sells products with solar energy and LEDs applications, but also to the defense and oil and gas industries. It doesnÕt provide a revenue breakdown between these end-markets, so we exclude it for lacking sufficient information.
|
|
|
Biofuels
|
.png) Eaton
|
Failed Defense Filter
|
Eaton makes 62% of its revenue by improving grid flexibility by selling various electrical and power products.
|
|
|
Solar, Concentrated
|
 Eco Wave Power
|
Failed Market Cap Filter
|
Eco Wave is a pure play that makes technology that converts ocean and sea waves into clean electricity.
|
|
|
Bioplastics
|
 Ecolab
|
Lacked Sufficient Information
|
Ecolab offers products to help businesses conserve water, but it also provides products and programs designed for oil companies. Since it doesnÕt give a revenue breakdown between these end-markets, we exclude it for lacking sufficient information.
|
|
|
Electrical Utility
|
%20Logo.jpg) Edison International
|
Lacked Sufficient Information
|
Edison International is an electric utility but it doesnÕt give enough information about its power generation sources.
|
|
|
Critical Minerals
|
EHang Holdings Limited
|
Lacked Sufficient Information
|
EHang provide electric short range flights. However they also provide aerial surveillance and advertising/entertainment. It is not clear how much revenue comes from each branch
|
|
|
Energy Storage
|
Electra Battery Materials Corporation
|
Failed Market Cap Filter
|
We're keeping an eye on them, but as of last annual rebalance, they fell below our $250m market cap exclusion.
|
|
|
Energy Storage
|
Electrovaya Inc.
|
Failed Market Cap Filter
|
We're keeping an eye on them, but as of last annual rebalance, they fell below our $250m market cap exclusion.
|
|
|
Electrical Utility
|
%20Logo.jpg) Ellomay Capital
|
Failed Utility Filter
|
Ellomay is an electric utility that produces 62.9% of its power from gas and diesel oil, failing our utility filter.
|
|
|
Critical Minerals
|
%20Logo.jpg) eMagin
|
Failed Defense Filter
|
eMagin sells night vision/thermal imaging goggles to customers in the military, failing our defense filter.
|
|
|
Solar, PVs
|
.jpg) Emeren Group Ltd.
|
Failed Market Cap Filter
|
ReneSola constructs solar projects and sells project rights.
|
|
|
Water Distribution
|
%20Logo.png) Emerson Electric
|
Failed Revenue Filter
|
Emerson makes smart thermostats, which are a climate solution. But it also makes a larger proportion of revenue from products and services for the oil and gas industries.
|
|
|
Energy Storage
|
%20Logo.jpg) Empresa Distribuidora y Comercializadora Norte Sociedad Anónima
|
Lacked Sufficient Information
|
EDN is an electric utility but it doesnÕt provide complete enough information about its power generation sources.
|
|
|
Water Distribution
|
%20Logo.png) Enbridge
|
Failed Revenue Filter
|
Enbridge is an energy infrastructure company that gets some of its revenue from solar and wind energy. But most of its revenue comes from building gas and oil pipelines, and gas infrastructure. It fails our revenue filter.
|
|
0.1006%
|
Pure Play
|
enCore Energy is a US-based miner and refiner of uranium, the key component for nuclear power which is one of the few 24/7 providers of zero-carbon electricity.
|
||
|
|
Electrical Utility
|
%20Logo.png) Enel Chile
|
Failed Utility Filter
|
Enel Chile is a Chilean electric utility. 65.9% of the electricity it generates is from clean sources, but they don't disclose how much of the power they transmit is from clean generation. We exclude them for lacking sufficient information.
|
|
|
LED
|
 Energy Focus
|
Failed Market Cap Filter
|
Energy Focus makes a variety of LED lighting products that emit the same light for less electricity.
|
|
0.1676%
|
Passed Mining Filter
|
Energy Fuels generates a majority of its revenue from the mining and processing of uranium, vanadium, and rare earth metals, all of which are needed to decarbonize our economy.
|
||
|
0.0384%
|
Pure Play
|
Energy Vault is an energy storage pure play that makes gravity-based, grid-scale energy storage solutions.
|
||
|
|
Grid Expansion
|
 EnerSys
|
Failed Defense Filter
|
EnerSys is an electrical equipment company. It sells specialty batteries with aerospace ad defense applications, missiles and smart weapons, so it fails our defense filter.
|
|
0.7680%
|
Pure Play
|
Enlight Renewable is a renewable energy developer of wind and solar projects.
|
||
|
|
Electric Aviation
|
Enovix Corporation
|
Lacked Sufficient Information
|
Enovix is a battery maker but they make batteries for many applications including non-climate solutions like smart phones and laptops. They do not disclose the revenue breakdown from each, so we exclude them.
|
|
0.9868%
|
Pure Play
|
Enphase sells microinverters, energy monitoring software, and AC batteries to solar distributors.
|
||
|
|
Electrical Utility
|
%20Logo.png) Entergy
|
Failed Utility Filter
|
Entergy is an electric utility that produces 78% of its power from fossil fuels, including coal with no plans to retire its coal plants. It fails our utility and coal filters.
|
|
0.0683%
|
Passed Revenue Filter
|
Enviri Corporation (formerly Harsco) generates a majority of its revenue from industrial and metal recycling, both important climate solutions that reduce demand for virgin materials to be extracted from the earth
|
||
|
|
Food Waste
|
Envirotech Vehicles, Inc.
|
Failed Market Cap Filter
|
We're keeping an eye on them, but as of last annual rebalance, they fell below our $250m market cap exclusion.
|
|
0.1231%
|
Pure Play
|
Eos is a pure play that makes energy storage solutions to utilities and other customers.
|
||
|
|
Perennial Staple Crops
|
Erayak Power Solution Group Inc.
|
Failed Market Cap Filter
|
We're keeping an eye on them, but as of last annual rebalance, they fell below our $250m market cap exclusion.
|
|
0.2167%
|
Passed Mining Filter
|
Ero Copper owns three copper mines in Brazil. Copper is a critical mineral for the buildout of a zero carbon electrical future as it is used both in electric motors and expanding the grid. It is also infinitely recyclable.
|
||
|
|
Water Distribution
|
%20Logo.png) ESCO Technologies
|
Failed Defense & Revenue Filter
|
ESCO is a technology company that makes products that promote grid flexibility, a climate solution. But it also sells many products used with aerospace and defense applications. It therefore fails out defense filter.
|
|
|
Solar, PVs
|
ESGL Holdings Limited
|
Failed Market Cap Filter
|
We're keeping an eye on them, but as of last annual rebalance, they fell below our $250m market cap exclusion.
|
|
|
Electric Cars
|
 ESS Tech, Inc.
|
Failed Market Cap Filter
|
ESS is a pure play in long-duration energy storage that makes iron flow battery technology.
|
|
|
Telepresence
|
%20Logo.jpg) Euro Tech Holdings
|
No Drawdown Solution
|
Euro Tech makes water treatment equipment and other products. But they donÕt offer any climate solutions.
|
|
0.1794%
|
Pure Play
|
Eve Holdings is developing an electric helicopter so people can move more quickly around urban settings without fossil fuels.
|
||
|
|
Electrical Utility
|
%20Logo.png) Evergy
|
Failed Utility Filter
|
Evergy is an electric utility that produces 64% of its power from fossil fuels, including coal, with no plans to retire its coal plants. It fails our utility and coal filters.
|
|
|
Electrical Utility
|
%20Logo.png) Eversource Energy
|
Failed Utility Filter
|
Most of Eversource's revenue comes from electric, gas and water distribution, which are not climate solutions.
|
|
0.1348%
|
Pure Play
|
EVgo is a EV infrastructure pure play that owns and operates the largest public fast EV charging network in the US. The network is 100% powered by renewable electricity through the use of renewable energy certificates.
|
||
|
|
Biofuels
|
%20Logo.jpg) Evoqua Water Technologies
|
No Drawdown Solution
|
Evoqua offer technologies mostly focused on removing impurities from water. It doesn't make any leak detection technologies, so it fails our water distribution efficiency filter.
|
|
|
Electrical Utility
|
.png) Exelon
|
Failed Utility Filter
|
Exelon is an energy utility. 75.8% of the electricity it generates comes from clean sources, but only about 40% of the electricity they transmit and distribute is clean, leading them to fail our utility filter.
|
|
|
Grid Expansion
|
 Expion360 Inc.
|
Failed Market Cap Filter
|
Expansion360 sells lithium-ion batteries for RVs, golf carts and marine vehicles. Because these are not replacing previously fossil-fuel powered engines, they donÕt count as climate solutions.
|
|
|
Dynamic Glass
|
 EZGO Technologies
|
Failed Market Cap Filter
|
EZ is a pure play that makes e-bicycles, e-tricycles, and lithium batteries for the Chinese market.
|
|
|
Electric Cars
|
 Faraday Future Intelligent Electric Inc.
|
Failed Market Cap Filter
|
Faraday is a pure play that intends to start building electric cars.
|
|
2.0953%
|
Pure Play
|
First Solar sells solar modules and power plant solutions.
|
||
|
|
Electrical Utility
|
%20Logo.png) FirstEnergy
|
Failed Utility Filter
|
FirstEnergy is an electric utility that produces 86.6% of its power from coal and doesnÕt plan to retire its coal plants fully until 2050. It fails our utility and coal filters.
|
|
|
Electric Cars
|
%20Logo.jpg) Flexible Solutions International
|
Failed Market Cap Filter
|
Flexible Solutions makes nitrogen conservation products, a climate solution, but also produces products for the oil and gas industries. It doesn't give a revenue breakdown, so we exclude it for lack of sufficient information.
|
|
0.3223%
|
Pure Play
|
Fluence is a pure play that provide energy storage products & services, and AI-enabled digital applications for renewables and storage.
|
||
|
|
Energy Storage
|
 Flux Power Holdings
|
Failed Market Cap Filter
|
Flux makes battery management systems and rechargeable lithium-ion energy storage systems for electric forklifts, airport ground support equipment, and other industrial motive applications.
|
|
|
Food Waste
|
Fly-E Group, Inc.
|
Failed Market Cap Filter
|
We're keeping an eye on them, but as of last annual rebalance, they fell below our $250m market cap exclusion.
|
|
|
Electric Cars
|
%20Logo.png) Ford Motor
|
Failed Revenue Filter
|
Ford Motors makes EVs but makes most of its revenue from traditional internal combustion vehicles. It fails our revenue filter.
|
|
|
Food Waste
|
Foremost Clean Energy Ltd.
|
Failed Market Cap Filter
|
We're keeping an eye on them, but as of last annual rebalance, they fell below our $250m market cap exclusion.
|
|
|
Electrical Utility
|
%20Logo.jpg) Fortis
|
Failed Utility Filter
|
Fortis is an electric utility that makes a vast majority of its power from coal and natural gas. It fails both our utility and coal filters.
|
|
|
Electric Boats
|
Forza X1, Inc.
|
Failed Market Cap Filter
|
We're keeping an eye on them, but as of last annual rebalance, they fell below our $250m market cap exclusion.
|
|
|
Water Distribution
|
%20Logo.png) Franklin Electric
|
No Drawdown Solution
|
Franklin Electric makes industrial machinery like water pumping systems, groundwater equipment, submersible motors, etc. But they donÕt make leak detection or water conservation technologies, so they donÕt offer any climate solutions.
|
|
|
Critical Minerals
|
 Freeport-McMoRan Inc.
|
Failed Ethical Filter
|
While FCX generated over >87% of its revenue from the sale of copper and molybdenum (both needed for the energy transition), it has had credible human rights allegations brought against it for violently suppressing indigenous communities and causing significant environmental pollution (The "Toxic 100 Air Polluters Index" compiled by the Political Economy Research Institute at UMass Amherst ranks FCX as #20). Therefore we exclude it.
|
|
|
Electric Cars
|
 Freight Technologies Inc
|
Failed Market Cap Filter
|
Freight Technologies is a pure play in efficient shipping that produced the FR8App. The FR8App is a B2B marketplace to make cross-border freight efficient and transparent, thus reduces the carbon footprint from shipping by optimizing empty miles.
|
|
|
Energy Storage
|
 FREYR Battery
|
Failed Market Cap Filter
|
FREYR Battery is working to develop the most cost-competitive batteries with the lowest carbon footprints. It has not generated any reveue as of July 2022
|
|
|
Industrial Recycling
|
 FTC Solar
|
Failed Market Cap Filter
|
FTC Solar sells solar tracking systems that identifies the best positioning for a solar array to increase energy production.
|
|
|
Energy Storage
|
%20Logo.png) FuelCell Energy
|
Failed Market Cap Filter
|
FuelCell Energy makes hydrogen fuel cells. But itÕs also developing carbon capture services but not storage, which we consider fossil fuel revenue. We exclude it for lack of sufficient information about the breakdown between these two revenue sources.
|
|
|
Fuel Cells
|
.png) Fusion Fuel Green
|
Failed Market Cap Filter
|
Fusion Fuel Green makes green hydrogen an important climate solution
|
|
0.0240%
|
Passed Revenue Filter
|
Future Fuels makes 79% of revenue from biofuels made mostly from cooking oils, other plant oils and animal fats. FF predominantly offers "Advnaced Biofuels" and thus pass our biofuel filters.
|
||
|
|
Plant-based diet
|
 Gatos Silver, Inc.
|
Failed Mining Filter
|
GATO operates numerous underground mines in Mexico generating a majority of its revenue from: silver, lead, and zinc, all critical minerals for the energy transition.
|
|
5.0000%
|
Pure Play
|
GE Vernova is the renewable energy spinout from GE for what is primarily their wind energy business.
|
||
|
|
Water Distribution
|
%20Logo.jpg) Generac Holdings
|
Lacked Sufficient Information
|
Generac makes power generation equipment and energy storage systems. It seems that most of its generators are fueled by fossil fuels. Since they don't give a breakdown of fossil fuel vs. clean products, we exclude them for lack of sufficient information.
|
|
|
Critical Minerals
|
%20Logo.png) General Electric
|
Failed Defense Filter
|
General Electric derives a small portion of revenue from wind energy. But a larger portion of revenue comes from oil and gas industries, and they also make jet engines for military aircrafts. It fails both the defense and revenue filters.
|
|
|
Plant-Based Diet
|
%20Logo.png) General Motors
|
Failed Revenue Filter
|
General Motors makes some EVs but makes most of its revenue from traditional internal combustion vehicles. It fails our revenue filter.
|
|
|
Electrical Utility
|
%20Logo.jpg) Genie Energy
|
Failed Utility Filter
|
Genie Energy is an electric utility. ItÕs not clear what the source of its electric generation is, so we exclude it for lack of sufficient information.
|
|
|
Fuel Cells
|
%20Logo.png) Genuine Parts
|
Failed Revenue Filter
|
Genuine Parts sells auto parts. It seems to get some revenue from the EV industry, but most of its business is with the internal combustion vehicle market. It fails our revenue filter.
|
|
0.0664%
|
Pure Play
|
Gevo makes renewable fuels. 75% of its revenue came from ethanol and other conventional biofuels. To pass our biofuel filter, a company needs to make most of its revenue from advanced biofuel. Gevo fails this filter.
|
||
|
2.5395%
|
Passed Landfill Filter
|
CSW makes 69% of its revenue from products that make heating and cooling systems more efficient.
|
||
|
|
Heat Pumps
|
.png) Gibraltar Industries
|
Failed Revenue Filter
|
Gibraltar Industries makes solar racking and electrical balance of systems, but these only account for 32% of its total revenue. It fails our revenue filter.
|
|
|
Water Distribution
|
 Ginkgo Bioworks Holdings
|
Failed Revenue Filter
|
Waste Management has methane capture systems at 144 out of 260 landfill in operations. Since it has methane capture systems at more than 50% of its landfill sites, Waste Management passes our landfill filter.
|
|
|
LED
|
 GMS Inc.
|
No Drawdown Solution
|
GMS sells products for construction, including insulation, lumber, joint compound, fasteners, etc. It fails the revenue filter because the revenue from insulation was only 28.7%.
|
|
|
Energy Storage
|
 Gogoro Inc.
|
Failed Market Cap Filter
|
Gogoro is an EV pure play that makes smart, swappable electric fuel and intelligent light urban vehicles.
|
|
|
Electric Two Wheelers
|
 Gold Resource Corporation
|
Failed Market Cap Filter
|
Gold Resource Corporation engages in the exploration, development, and production of mining projects in Mexico and the United States. About 73% of its 2021 revenue came from silver, copper, lead and zinc, all minerals the IEA considers essential for the energy transition.
|
|
|
Solar, PVs
|
Golden Minerals Company
|
Failed Market Cap Filter
|
We're keeping an eye on them, but as of last annual rebalance, they fell below our $250m market cap exclusion.
|
|
0.0460%
|
Pure Play
|
GrafTech is a pure play in arc smelting. It produces graphite electrodes and petroleum needle coke, both necessary components in electric arc furnaces, which is a more energy efficient way of making steel compared to blast furnaces.
|
||
|
|
Grid Expansion
|
%20Logo.jpg) Graham
|
Failed Defense & Revenue Filter
|
Graham is an industrial machinery company. 52% of its revenue came from the defense industry, and 44% from the refining, chemical and petrochemical markets. It therefore fails our defense and revenue filters.
|
|
|
Water Distribution
|
%20Logo.png) Granite Construction
|
No Drawdown Solution
|
Granite Construction is an infrastructure company. It doesnÕt make any water leak detection or water conservation technology, leaving it without a climate solution.
|
|
|
Electric Two Wheelers
|
Graphex Group Limited
|
Failed Market Cap Filter
|
We're keeping an eye on them, but as of last annual rebalance, they fell below our $250m market cap exclusion.
|
|
|
Heat Pumps
|
%20Logo.jpg) Green Plains
|
Failed Biofuel Filter
|
Green Plains is one of the largest manufacturers of ethanol from corn. It fails our biofuel filter, which requires that advanced biofuels make up more than 50% of a company's biofuel production.
|
|
|
Energy Storage
|
Greenland Technologies Holding Corporation
|
Failed Market Cap Filter
|
We're keeping an eye on them, but as of last annual rebalance, they fell below our $250m market cap exclusion.
|
|
|
Food Waste
|
Greenwave Technology Solutions, Inc.
|
Failed Market Cap Filter
|
We're keeping an eye on them, but as of last annual rebalance, they fell below our $250m market cap exclusion.
|
|
0.3326%
|
Pure Play
|
Hannon Armstrong is an yieldco that's purely focused on generating clean electricity. 100% of the electricity it generates comes from renewables.
|
||
|
|
Electrical Utility
|
%20Logo.jpg) Hawaiian Electric Industries
|
Failed Utility Filter
|
Hawaiian Electric is an electric utility that produce ~99% of its power from fossil fuels. It fails our utility filter.
|
|
|
Nutrient Management
|
 Heliogen, Inc.
|
Failed Market Cap Filter
|
Heliogen is an electric utility that's purely focused on generating electricity. 100% of the electricity it generates comes from renewables.
|
|
|
Water Distribution
|
%20Logo.png) Helios Technologies
|
No Drawdown Solution
|
Helios Technologies makes a variety of hydraulic products but not leak detection or water conservation technologies.
|
|
|
Mass Transit
|
Heramba Electric plc
|
Failed Market Cap Filter
|
We're keeping an eye on them, but as of last annual rebalance, they fell below our $250m market cap exclusion.
|
|
|
Net-zero building
|
%20Logo.png) Honda Motor
|
Lacked Sufficient Information
|
Honda makes some EVs (in Europe) but its EV manufacturing is still in early stages. No precise revenue breakdown is given but itÕs clear that most of its revenue comes from internal combustion vehicles.
|
|
|
Wind Power
|
%20Logo.jpg) Honeywell International
|
Failed Defense Filter
|
Honeywell is a technology company with an aerospace segment, which we categorize as fossil fuel revenue. It also sells products to the defense industry. It fails our revenue and defense filters.
|
|
2.4194%
|
Passed Revenue Filter
|
Hubbel sells solutions that enhance grid expansion/flexibility and EV charging, which are climate solutions, but it also has customers in the gas industry. We exclude it for lacking sufficient information.
|
||
|
0.0280%
|
Pure Play
|
Hudson makes various refrigerant management solutions an important climate solution.
|
||
|
|
Critical Minerals
|
 Hycroft Mining Holding Corporation
|
Failed Mining Filter
|
Hycroft Mining together with its subsidiaries, operates as a gold and silver development company in the United States. As of December 31, 2022. About 90.1% of its 2021 revenue came from gold sales, so it fails the 50% revenue filter.
|
|
0.0462%
|
Pure Play
|
Hyliion makes electrified and hybrid powertrain solutions. Its solutions contribute to the climate solutions of hybrid and electric vehicles.
|
||
|
|
Energy Storage
|
 Hyzon Motors Inc.
|
Failed Market Cap Filter
|
Hyzon is a pure play that makes and services hydrogen fuel cell electric vehicles.
|
|
|
Telepresence
|
 IBM
|
Failed Telepresence Filter
|
IBM sells computer hardware, middleware and software. Some of its products contribute to telepresence, but since IBM is not a telepresence pure play, it fails our revenue filter.
|
|
|
Electric Cars
|
ICF International, Inc.
|
Failed Revenue Filter
|
ICF is a consulting company. But revenue from energy, environment and infrastructure accounts for a minority of its revenue, so they fail the revenue filter.
|
|
|
Energy Storage
|
Ideal Power Inc.
|
Failed Market Cap Filter
|
We're keeping an eye on them, but as of last annual rebalance, they fell below our $250m market cap exclusion.
|
|
|
EV Infrastructure
|
%20Logo.png) Ideanomics
|
Failed Market Cap Filter
|
Ideanomics makes 73% of its revenue from EVs and EV charging infrastructure.
|
|
|
Grid Expansion
|
%20Logo.jpg) IES Holdings
|
Failed Revenue Filter
|
IES services wind and solar energy projects, which promote these climate solutions. But it also services refineries. ItÕs not clear which makes up a bigger portion of its revenue, so we exclude it for lacking sufficient information.
|
|
|
Arc Smelting
|
 Ingredion INC
|
Failed Plant-Based Diet Filter
|
Ingredion converts plants into value-added ingredients and biomaterials for food industries. But since its products donÕt replace animal-based foods, it fails our plant-based diet filter.
|
|
0.5045%
|
Passed Revenue Filter
|
Installed Building Products sells and installs insulation for residential and commercial builders, an important climate solution to make buildings more energy efficient.
|
||
|
0.0398%
|
Passed Mining Filter
|
IONR is a pure-play lithium mining company based in Nevada that has offtakes contracts in place with several major electric vehicle and battery manufacturers.
|
||
|
0.1111%
|
Passed Revenue Filter
|
IPX operates an open-pit mine in Tennessee. 100% of its revenue comes from the sale of titanium, a critical mineral for the energy transition according to the IEA.
|
||
|
0.5030%
|
Passed Revenue Filter
|
Itron makes 61% of its revenue from devices that measure and control water, smart meters and leak detection products, all climate solutions.
|
||
|
0.1583%
|
Pure Play
|
Jinko sells solar modules, silicon wafers, solar cells, recovered silicon materials, and silicon ingots, and constructs solar projects.
|
||
|
|
Electric Cars
|
 Jiuzi Holdings
|
Failed Market Cap Filter
|
Jiuzi is a pure play that makes EVs in China.
|
|
0.7696%
|
Pure Play
|
Joby is a pure play in electric aviation thatÕs making an all-electric aircraft that can carry a pilot and 4 passengers, replacing the need for fossil fuel powered short haul flights.
|
||
|
5.0000%
|
Passed Revenue Filter
|
Johnson Controls makes HVAC solutions including high-efficiency heat pumps, and build net-zero building systems. These products and services account for 72% of its revenue.
|
||
|
|
Telepresence
|
 Kaltura
|
Failed Market Cap Filter
|
Kaltura offers video products that are heavily used in distance learning for virtual classrooms, thus reducing the need for students to physically travel to and from class.
|
|
|
Energy Storage
|
 Kandi Technologies Group
|
Failed Market Cap Filter
|
Kandi made 61% of its revenue from EV parts and electric scooters.
|
|
|
Grid Expansion
|
%20Logo.png) Karat Packaging
|
Failed Revenue Filter
|
Karat Packaging makes packaging with both traditional and bioplastics. ItÕs not clear which makes up a bigger portion of its revenue, so we exclude it for lacking sufficient information.
|
|
|
Electrical Utility
|
%20Logo.png) Kenon Holdings
|
Failed Utility Filter
|
Kenon is an electric utility that produces most of its power from gas and oil. It fails our utility filter.
|
|
|
Electrical Utility
|
%20Logo.jpg) Korea Electric Power
|
Failed Utility Filter
|
Korea Electric Power is the largest power producer in Korea with large nuclear and hydro plants, but coal is its largest source of generation. It fails our utility and coal filters.
|
|
|
Electric Cars
|
 KULR Technology Group
|
Failed Market Cap Filter
|
KULR is a pure play that makes thermal management technologies used in lithium-ion batteries to ensure that the batteries stay within safe operating temperatures.
|
|
|
Critical Minerals
|
L.B. Foster Company
|
Failed Market Cap Filter
|
We're keeping an eye on them, but as of last annual rebalance, they fell below our $250m market cap exclusion.
|
|
|
Nuclear Power
|
.jpg) Laird Superfood
|
Failed Market Cap Filter
|
Laird sells plant-based foods like hydrate coconut water and renew plant-based proteins.
|
|
0.0391%
|
Pure Play
|
LanzaTech is an American company that finds commercial uses for waste carbon dioxide as a form of carbon sequestration.
|
||
|
|
Electric Cars
|
Largo Inc.
|
Failed Market Cap Filter
|
We're keeping an eye on them, but as of last annual rebalance, they fell below our $250m market cap exclusion.
|
|
|
Hybrid Cars
|
%20Logo.png) Lear
|
Failed Revenue Filter
|
Lear makes some electrification products, but 94% of its revenue comes from supplying products for traditional automotive. It therefore fails our revenue filter.
|
|
2.2234%
|
Passed Revenue Filter
|
Lennox sells HVAC systems including high-efficiency heat pumps.
|
||
|
2.5897%
|
Pure Play
|
Li Auto builds electric SUVs and luxury vehicles in China.
|
||
|
|
Nuclear Power
|
 Li-Cycle Holdings Corp
|
Failed Market Cap Filter
|
Li-Cycle is a pure play in recycling that recycles lithium-ion batteries.
|
|
|
Recycled Metals
|
Lifezone Metals Limited
|
Lacked Sufficient Information
|
According to their 20f, Lifezone "do not expect to generate any revenue from our mining projects in the foreseeable future." so we exclude them
|
|
|
Industrial Recycling
|
.jpg) Lightbridge Corporation
|
Failed Market Cap Filter
|
Lighbridge focuses on the development of metallic nuclear fuels, which are safer and more economical, while effectively reducing carbon emissions.
|
|
|
Recycling
|
Lilium N.V.
|
Failed Market Cap Filter
|
We're keeping an eye on them, but as of last annual rebalance, they fell below our $250m market cap exclusion.
|
|
|
Retrofit
|
.jpg) Limbach Holdings
|
Lacked Sufficient Information
|
Limbach provides a number of climate solutions, including energy audits and building retrofits, but they donÕt provide a revenue breakdown. We exclude them for lack of sufficient information.
|
|
|
Solar, PVs
|
%20Logo.png) Limoneira
|
Failed Revenue Filter
|
Limoneira grows a number of crops, including avocados, a perennial staple crop thatÕs a climate solution. But since avocados only account for 4% of its total revenue, it fails our revenue filter.
|
|
|
Electric Cars
|
.png) Lindsay
|
Lacked Sufficient Information
|
Lindsay sells irrigation systems, remote monitoring and automation technology that reduce water and energy consumption. But because a clear revenue breakdown between these solutions isnÕt given, we exclude it for lacking sufficient information.
|
|
0.1026%
|
Pure Play
|
Liquidity Services helps businesses and governments avoid sending their surpluses to the landfill and instead find willing buyers, helping them generate more revenue and reduce the demand for new products in the market.
|
||
|
0.0566%
|
Passed Mining Filter
|
Lithium Americas is a pure play lithium miner. Lithium is a key resource for lithium ion batteries, a critical climate solution
|
||
|
0.0566%
|
Passed Mining Filter
|
LAC is a pure-play lithium mining company focused on extracting and refining battery-grade lithium.
|
||
|
|
LED
|
%20Logo.jpg) Littelfuse
|
Lacked Sufficient Information
|
Littelfuse is an industrial technology company offering several climate solutions. But it also serves several fossil fuel industries. ItÕs not clear which makes up a bigger portion of its revenue.
|
|
0.1007%
|
Pure Play
|
Livewire is an electric motorcycle company that was spun off from Harley Davidson.
|
||
|
0.9778%
|
Pure Play
|
LKQ scraps totaled cars and sells the reclaimed replacement parts, helping reduce automotive waste.
|
||
|
|
Electric Aviation
|
Lobo EV Technologies Ltd.
|
Failed Market Cap Filter
|
We're keeping an eye on them, but as of last annual rebalance, they fell below our $250m market cap exclusion.
|
|
|
Industrial Recycling
|
.jpg) Loop Industries
|
Failed Market Cap Filter
|
Loop converts waste plastics into virgin quality plastic.
|
|
0.2654%
|
Pure Play
|
Lotus is a Chinese EV manufacturer that focuses on lifestyle vehicles in the fast-growing Chinese EV market.
|
||
|
0.0598%
|
Passed Revenue Filter
|
LSI makes 67% of its revenue from LEDs for lighting used in parking garages and restaurants.
|
||
|
1.0262%
|
Pure Play
|
Lucid is a pure play that makes electric cars and battery systems.
|
||
|
|
LED
|
Magnachip Semiconductor
|
Failed Revenue Filter
|
Magnachip makes LEDs for a variety of applications, including e-bikes, solar PV converters, and lighting. But these applications seems to make up a minority of its total revenue, so it fails our revenue filter.
|
|
|
Grid Expansion
|
.jpg) MasTec
|
Failed Revenue Filter
|
MasTech promotes wind and solar energy as well as grid flexibility. But since these climate solutions make up less than 50% of total revenue, it fails our revenue filter.
|
|
|
Solar, PVs
|
 Maxeon Solar Technologies
|
Failed Market Cap Filter
|
Maxeon sells solar panels and other related components.
|
|
|
Electrical Utility
|
%20Logo.jpg) MDU Resources Group
|
Failed Utility Filter
|
MDU produces 72.7% of its power from fossil fuels (coal, gas and diesel) and 27.3% from renewables (wind and heat recovery). They retired 3 coal-fired units in February 2019, but have no plans to retire any more coal plants in the future. Thus it fails our Green Utilities filter.
|
|
|
Critical Minerals
|
 Mesabi Trust
|
Failed Mining Filter
|
Anderson refines corn into ethanol, which is a Climate solution, but it’s a very small part of its revenue. It fails the revenue filter.
|
|
0.0608%
|
Pure Play
|
Timken Steel makes special bar quality bars from nearly 100% recycled scrap metal. But they also make components for the military, including missile components, projectiles, gun barrels, and vehicle driveline components. So they fail our defense filter.
|
||
|
0.0747%
|
Passed Mining Filter
|
MTAL is a mining company that generates over 96% of its revenue from copper, a key mineral in the energy transition that is also infinitely recyclable.
|
||
|
|
Electrical Utility
|
%20Logo.png) MGE Energy
|
Failed Utility Filter
|
MGE produces 76.2% of its energy from fossil fuels and 23.8% from renewables (wind and solar), thus failing our defense filter
|
|
|
Energy Storage
|
 Microvast Holdings Inc
|
Failed Market Cap Filter
|
Microvast is a pure play that designs and manufactures EV battery and energy storage with ultra-fast charging capabilities.
|
|
0.0651%
|
Pure Play
|
Montauk is an electric utility that's purely focused on generating electricity. 100% of the electricity it generates comes from biogas, which is a renewable source.
|
||
|
|
Telepresence
|
%20Logo.jpg) Montrose Environmental Group
|
Failed Revenue Filter
|
Montrose helps clients deal with water distribution issues among other pro-climate projects, but it also works with many O&G companies, petrochemical and tobacco industries. It is unclear what makes up a majority of its revenue.
|
|
0.3417%
|
Passed Mining Filter
|
MP is mining company focused on rare earth extraction and processing in the Western Hemisphere. Rare earth elements are critical minerals for the energy transition.
|
||
|
|
Water Distribution
|
 Mueller Industries
|
No Drawdown Solution
|
Mueller Industries produces a broad range of copper, brass, aluminum and plastic products. These include a variety of water tubes for plumbing applications. But they don't produce any leak detection or water conservation technologies and therefore fails our water distribution efficiency filter.
|
|
|
Mass Transit
|
.png) Mueller Water Products
|
Failed Revenue Filter
|
Mueller Water Products sells water leak detection systems but these make up a small portion of its overall revenue. It fails our revenue filter.
|
|
|
Electric Cars
|
 Mullen Automotive, Inc.
|
Failed Market Cap Filter
|
Mullen is a pure play EVs manufacturer with both personal and comercial products in development.
|
|
0.2461%
|
Passed Revenue Filter
|
MYRG offers a wide range of products to the electric utility industry, but it doesnÕt give a precise breakdown between these products. We exclude it for lacking sufficient information.
|
||
|
|
EV Supply Chain
|
N2OFF, Inc.
|
Failed Market Cap Filter
|
We're keeping an eye on them, but as of last annual rebalance, they fell below our $250m market cap exclusion.
|
|
|
Recycling
|
NaaS Technology Inc.
|
Failed Market Cap Filter
|
We're keeping an eye on them, but as of last annual rebalance, they fell below our $250m market cap exclusion.
|
|
|
Mass Transit
|
NACCO Industries, Inc.
|
Failed Market Cap Filter
|
We're keeping an eye on them, but as of last annual rebalance, they fell below our $250m market cap exclusion.
|
|
0.1219%
|
Pure Play
|
Nano Nuclear Energy is developing nuclear micro-reactors that, once commercially available, could enable the expansion of nuclear energy in a far more repeatable, easy to scale way than how traditional nuclear plants are built today.
|
||
|
|
Electrical Utility
|
%20Logo.jpg) National Grid
|
Lacked Sufficient Information
|
NGG is a utility that owns electric transmission facilities and gas pipelines in the UK and the US. ItÕs not clear which makes up a bigger portion of its revenue, and we also donÕt know how it generates its electricity.
|
|
|
Carbon Management
|
NeoVolta Inc.
|
Failed Market Cap Filter
|
We're keeping an eye on them, but as of last annual rebalance, they fell below our $250m market cap exclusion.
|
|
|
Critical Minerals
|
 Newmont Corporation
|
Failed Mining Filter
|
Newmont Corporation engages in the production and exploration of gold. It also explores for copper, silver, zinc, and lead. 86% of its 2021 revenue came from gold sales, it therefore fail the 50% revenue filter.
|
|
0.6188%
|
Pure Play
|
NexGen explores and develops uranium projects in Canada.
|
||
|
|
Electrical Utility
|
.png) NextEra Energy
|
Failed Utility Filter
|
NextEra Energy is an electric utility. The fail our Green Utilities filter because only 22%-23% of the electricity they transmit on its power lines comes from clean sources (must be >50%).
|
|
0.1792%
|
Pure Play
|
NextEra Energy Partners is an yieldco that generates 73% of its total revenue from electricity generation. 90% of the electricity it generates comes from renewable sources.
|
||
|
0.5904%
|
Pure Play
|
NextTracker is a pure play solar tracking company that enables solar farms to automatically follow the arc of the sun for optimal performance.
|
||
|
|
Critical Minerals
|
 Nikola
|
Failed Market Cap Filter
|
Nikola is an electric car pure play that makes electric and hydrogen fuel cell heavy-duty commercial vehicles as well as clean energy solutions.
|
|
1.0059%
|
Pure Play
|
NIIO builds electric SUVs and sedans in China with a subscription service for swappable batteries instead of conventional charching.
|
||
|
|
Electrical Utility
|
%20Logo.png) NiSource
|
Failed Utility Filter
|
NiSource is an electric utility that generates 82% of its power from fossil fuels, including coal which they plan to replace with renewables by 2028. ItÕs also building large-scale renewable power projects, so we will consider it for inclusion in the future.
|
|
|
Electric Two Wheelers
|
.png) Niu Technologies
|
Failed Market Cap Filter
|
Niu is a pure play that makes electric scooters. It has over 800,000 active riders.
|
|
|
Electric Cars
|
noco-noco Inc.
|
Failed Market Cap Filter
|
We're keeping an eye on them, but as of last annual rebalance, they fell below our $250m market cap exclusion.
|
|
|
Electrical Utility
|
%20Logo.gif) NorthWestern
|
Failed Utility Filter
|
Northwestern is an electric utility that produces 46% of its power from renewables and the rest from fossil fuels including coal. It fails our utility and coal filters.
|
|
|
Telepresence
|
Nouveau Monde Graphite Inc.
|
Failed Market Cap Filter
|
We're keeping an eye on them, but as of last annual rebalance, they fell below our $250m market cap exclusion.
|
|
|
District Heating
|
Nova Minerals Limited
|
Failed Market Cap Filter
|
We're keeping an eye on them, but as of last annual rebalance, they fell below our $250m market cap exclusion.
|
|
0.0430%
|
Pure Play
|
Novonix is an Australian company that makes a range of advanced battery materials for the EV and energy storage battery industries
|
||
|
|
Electrical Utility
|
%20Logo.jpg) NRG Energy
|
Failed Utility Filter
|
NRG is an electric utility that generates 92% of its power from fossil fuels, including coal. It fails our utility and coal filters.
|
|
2.8981%
|
Passed Revenue Filter
|
Nucor is a steel maker that uses scrap steel as primary raw material, and it produces steel using the more efficient electric arc furnaces. 92.9% of its revenue comes from these solutions.
|
||
|
0.6182%
|
Pure Play
|
NuScale is a nuclear pure play that builds and sells light water small modular reactor that range from 77MW to 924MW.
|
||
|
|
Electric Cars
|
 Nuvve Holding
|
Failed Market Cap Filter
|
Nuuve sells vehicle-to-grid technology that allows EV owners to store and resell energy to the grid.
|
|
|
Critical Minerals
|
%20Logo.jpg) NV5 Global
|
Lacked Sufficient Information
|
NV5 is an engineering and construction company that helps clients achieve net-zero emissions in its buildings. But it also works with many oil and gas companies. ItÕs not clear which of these accounts for more revenue.
|
|
|
Wind Power
|
.png) nVent Electric
|
Failed Defense & Revenue Filter
|
nVent is an electrical equipment company that sells military aerospace systems, battlefield networks and shipboard targeting systems, and combat aircrafts to the defense industry. It fails our defense filter.
|
|
|
Water Distribution
|
 Nvidia
|
No Drawdown Solution
|
Nvidia sells graphics processing units, application programming interface for data science and high-performance computing. Since they are not a telepresence pure play, they are excluded.
|
|
|
Land Management
|
NWTN Inc.
|
Failed Market Cap Filter
|
We're keeping an eye on them, but as of last annual rebalance, they fell below our $250m market cap exclusion.
|
|
|
Water Distribution
|
 NXP Semiconductors
|
No Drawdown Solution
|
NXP sells technology solutions to the automotive, industrial, Internet of Things, mobile, and communications infrastructure markets. But they donÕt offer any climate solutions.
|
|
|
Critical Minerals
|
Nxu, Inc.
|
Failed Market Cap Filter
|
We're keeping an eye on them, but as of last annual rebalance, they fell below our $250m market cap exclusion.
|
|
0.0434%
|
Pure Play
|
Oatly sells plant-based dairy products made from oats.
|
||
|
|
Solar, PVs
|
 Oblong, Inc.
|
Failed Market Cap Filter
|
Oblong sells products that enable dynamic and immersive visual collaboration across multiple users, screens, devices and locations, enabling individuals to collaborate without needing to physically travel.
|
|
|
Critical Minerals
|
 Ocean Power Technologies
|
Failed Market Cap Filter
|
Ocean Power uses ocean power to generate electricity, a climate solution. But it sells this technology to offshore oil and gas companies as an alternative to diesel generators. ItÕs not clear which end-market generates more revenue for Ocean Power.
|
|
|
Electrical Utility
|
%20Logo.jpg) OGE Energy
|
Failed Utility Filter
|
OGE is an electric utility that generates 93% of its power from fossil fuels, including coal. It fails our utility and coal filters.
|
|
0.3748%
|
Pure Play
|
Oklo Inc. designs and develops fission power plants to provide reliable and commercial-scale energy to customers in the United States. It also provides used nuclear fuel recycling services.
|
||
|
|
Electrical Utility
|
ON Semiconductor
|
Lacked Sufficient Information
|
ON makes semiconductors for many industries, including EV charging infrastructure. But we exclude them because they donÕt provide a revenue breakdown for each of its end-markets.
|
|
0.0591%
|
Pure Play
|
Opal fuels makes renewable natural gas which is a drop in replacement for natural gas derived from fossil fuels but is derived from contemporary sources like anaerobically digesting cow manure.
|
||
|
|
Electrical Utility
|
 Oracle
|
Failed Telepresence Filter
|
Oracle provices products and services that address enterprise information technology environments. Since theyÕre not a telepresence pure play, it fails the telepresence filter.
|
|
|
Electric Cars
|
 Origin Materials, Inc.
|
Failed Market Cap Filter
|
Origin Materials is a bioplastics pure play that converts sustainable feedstocks into plastics that can replace petroleum-based plastics.
|
|
|
LED
|
.png) Orion Energy Systems
|
Failed Market Cap Filter
|
Orion Energy is an LED lighting pure play and also works on retrofit projects.
|
|
0.4261%
|
Pure Play
|
Ormat produces geothermal energy systems that enable utilities to generate electricity using the heat from the earth.
|
||
|
|
Electrical Utility
|
%20Logo.png) Otter Tail
|
Failed Utility Filter
|
Otter Tail is an electric utility that generates 72% of its power from fossil fuels, including coal. It fails our utility and coal filters.
|
|
1.5027%
|
Passed Revenue Filter
|
Owens Corning makes building and construction materials. It make insulation, but this accounts for only 27% of its revenue, so it fails our revenue filter.
|
||
|
|
Electrical Utility
|
%20Logo.jpg) Pampa Energía
|
Failed Utility Filter
|
Pampa is an electric utility that generates 78% of its power from fossil fuels. It fails our utility filter.
|
|
|
Critical Minerals
|
 Paramount Gold Nevada Corp.
|
Failed Mining Filter
|
Paramount Gold Nevada Corp., together with its subsidiaries, engages in the acquisition, exploration, and development of precious metal properties in the United States. The company primarily explores for gold and silver ores. It holds principal interest in the Sleeper gold project with 2,322 unpatented mining claims totaling approximately 38,300 acres located in Humbolt County, Nevada. The company also holds 100% interest in the Grassy Mountain gold project with 442 federal mining claims and 3 patented lode claims covering approximately 9,300 acres located in Malheur County, Oregon. Paramount Gold Nevada Corp. was founded in 1992 and is headquartered in Winnemucca, Nevada.
|
|
|
Water Distribution
|
 Pentair
|
Lacked Sufficient Information
|
Pentair sells products designed to help customers conserve water, which is a climate solution, but also sells products built specifically for the fossil fuel industry. It's unclear which it makes more revenue from, so we exclude them for lacking sufficient information.
|
|
|
Energy Storage
|
 Perma-Fix Environmental Services
|
Failed Market Cap Filter
|
Perma-Fix promotes nuclear power through the treatment of nuclear waste and technical services like radiological measurement.
|
|
|
Electric Cars
|
 Perma-Pipe International Holdings
|
Failed Revenue Filter
|
Perma-Pipe makes water leak detection systems, but its application seems to be mostly in oil and gas pipelines, hazardous fluid and chemicals. A revenue breakdown between these application isnÕt given.
|
|
|
Electrical Utility
|
 PG&E
|
Failed Utility Filter
|
While 93% of the electricity PCG transmits is clean, only 45% of the energy the generate is clean, and 25% of its revenu comes from the sale of natural gas.
|
|
|
Energy Storage
|
Phoenix Motor Inc.
|
Failed Market Cap Filter
|
We're keeping an eye on them, but as of last annual rebalance, they fell below our $250m market cap exclusion.
|
|
|
Critical Minerals
|
Piedmont Lithium Inc.
|
Failed Market Cap Filter
|
We're keeping an eye on them, but as of last annual rebalance, they fell below our $250m market cap exclusion.
|
|
|
Efficient Shipping
|
Pineapple Energy Inc.
|
Failed Market Cap Filter
|
Pineapple Energy is a solar energy and energy storage pure play. Through consultation, home visits, design review, permitting, installation, inspection, and grid connection, Pineapple Energy helps households go solar.
|
|
|
Electrical Utility
|
%20Logo.jpg) Pinnacle West Capital
|
Failed Utility Filter
|
Pinnacle is an electric utility that generates 78% of its power from fossil fuels, including coal. It fails our utility and coal filters.
|
|
|
Electric Cars
|
Pioneer Power Solutions, Inc.
|
Failed Market Cap Filter
|
We're keeping an eye on them, but as of last annual rebalance, they fell below our $250m market cap exclusion.
|
|
|
Biomass
|
%20Logo.png) Planet Green Holdings
|
Failed Biofuel Filter
|
Planet Green makes ethanol, tea, chemicals and other products. It fails our biofuel filter, which requires that advanced biofuels make up more than 50% of a companyÕs biofuel production.
|
|
|
Energy Storage
|
Platinum Group Metals Ltd.
|
Failed Market Cap Filter
|
We're keeping an eye on them, but as of last annual rebalance, they fell below our $250m market cap exclusion.
|
|
0.2937%
|
Pure Play
|
Plug Power makes hydrogen fuel cell solutions through hydrogen fueling systems, proton exchange membrane technologies, and more.
|
||
|
|
Nuclear Power
|
%20Logo.png) PNM Resources
|
Failed Utility Filter
|
PNM is an electric utility that generates 56.4% of its power from fossil fuels, including coal. It fails our utility and coal filters.
|
|
|
Ocean Power
|
%20Logo.png) Polar Power
|
Failed Market Cap Filter
|
Polar Power makes DC power systems that promote the climate solution of grid flexibility. But diesel, gas, and propane seem to be its predominant formats. A revenue breakdown is not present, so we exclude it for lacking sufficient information.
|
|
0.2462%
|
Pure Play
|
Polestar is a prominent EV design and manufacturing company, focusing on high-end EVs, based out of Sweden.
|
||
|
|
Electrical Utility
|
%20Logo.jpg) Portland General Electric
|
Failed Utility Filter
|
Portland GE is an electric utility that generates 62% of its power from fossil fuels, including coal. It fails our utility and coal filters.
|
|
|
Heat Pumps
|
POSCO Holdings Inc.
|
Failed Revenue Filter
|
PKX derives most of its revenue from steel, but they derive it from virgin materials, not recycled steel, so it fails our recycled metals filter.
|
|
|
LED
|
.png) Power Integrations
|
Failed Revenue Filter
|
Power Integration sells integrated circuits and other electronic circuitry. Applications include LED lighting, but this is a small part of its revenue. It fails our revenue filter.
|
|
|
Electrical Utility
|
%20Logo.png) PPL
|
Failed Utility Filter
|
PPL is an electric utility that generates ~99% of its power from fossil fuels, including coal. It fails our utility and coal filter.
|
|
0.0635%
|
Passed Revenue Filter
|
Preformed Line Products makes 66% of its revenue from improving grid flexibility by maintenance of energy networks.
|
||
|
|
Electrical Utility
|
%20Logo.jpg) Public Service Enterprise Group
|
Failed Utility Filter
|
PSEG is a utility that generates ~64% of its power from fossil fuels. It fails our utility filter.
|
|
0.1915%
|
Pure Play
|
PureCycle converts waste plastics into virgin quality plastic.
|
||
|
|
Electrical Utility
|
 QualTek Services Inc.
|
Failed Revenue Filter
|
QualTeck has a renewables infrastructure business, but this only accounts for 5% of its revenue, hence failing the revenue filter.
|
|
0.1126%
|
Passed Revenue Filter
|
Quanex makes components for windows and doors to enhance its temperature insulation, as well as a sealant for solar panels to keep moisture out of PV cells. These solutions account for more than 70% of its revenue.
|
||
|
4.9551%
|
Passed Revenue Filter
|
Quanta Services gets 69% of its revenue from improving grid flexibility by maintaining electric power transmission, distribution infrastructure, and substation facilities.
|
||
|
0.3450%
|
Pure Play
|
QuantumScape is a pure play in solid-state lithium-metal batteries, some of which are used in EVs.
|
||
|
|
Plant-based diet
|
 Quest Resource
|
Failed Market Cap Filter
|
Quest is a recycling pure play that recycles a variety of items, like scrap tires, metal and glass.
|
|
0.0425%
|
Pure Play
|
Radius Recycling industries is North America's largest recyclers of ferrous & nonferrous metal (including end-of-life vehicles) and a manufacturer of finished steel products. Pure play recycled metal.
|
||
|
|
Industrial Recycling
|
Rail Vision Ltd.
|
Failed Market Cap Filter
|
We're keeping an eye on them, but as of last annual rebalance, they fell below our $250m market cap exclusion.
|
|
0.2618%
|
Pure Play
|
ReNew Power is a clean energy pure play that owns utility-scale wind, solar and hydropower assets totaling over 12GW of generating capacity.
|
||
|
5.0000%
|
Passed Landfill Filter
|
Republic makes part of its revenue from recycling, a climate solution. But because this accounts for only 3.7% of its total revenue, so it fails our recycling filter.
|
||
|
|
Dynamic Glass
|
.png) Research Frontiers
|
Failed Market Cap Filter
|
Research Frontiers makes suspended particle device light control technology that undergirds dynamic glass technology, which helps enhance energy efficiency in buildings.
|
|
|
EV Infrastructure
|
.png) ReTo Eco-Solutions
|
Failed Market Cap Filter
|
ReTo Eco-Solutions makes environmentally friendly construction materials using less carbon-intensive alternative materials.
|
|
|
Biofuels
|
%20Logo.png) REX American Resources
|
Failed Biofuel Filter
|
REX American Resources is one of the leading producers of corn-based ethanol and corn oil. It fails our biofuel filter, which requires that advanced biofuels make up more than 50% of a companyÕs biofuel production.
|
|
1.6412%
|
Pure Play
|
Rivian is a pure play that makes electric pickup trucks, SUVs, and EV charging solutions.
|
||
|
|
Water Distribution
|
.jpg) Roper Technologies
|
No Drawdown Solution
|
Roper Technologies makes software and measurement & analytical services for water meters that enable water utilities to remotely monitor customer water-use. But it doesnÕt make leak detection or water conservation solutions.
|
|
|
Solar, PVs
|
Safe & Green Holdings Corp.
|
Failed Market Cap Filter
|
We're keeping an eye on them, but as of last annual rebalance, they fell below our $250m market cap exclusion.
|
|
|
Energy Storage
|
SAIHEAT Limited
|
Failed Market Cap Filter
|
We're keeping an eye on them, but as of last annual rebalance, they fell below our $250m market cap exclusion.
|
|
|
LED
|
.jpg) SemiLEDs
|
Failed Market Cap Filter
|
SemiLEDs sells LED chips, components and modules which are used for general lighting.
|
|
|
Electrical Utility
|
 Sempra Energy
|
Failed Utility Filter
|
Sempra Energy is an energy utility. Only 29.5% of its electricity generation is clean, and 57.6% of its total revenue comes from gas distribution. We therefore exclude them from the Climate Index.
|
|
|
Electric Cars
|
 SES AI Corporation
|
Failed Market Cap Filter
|
SES is an energy storage pure play that builds high-performance lithium-ion batteries and EVs and other applications.
|
|
0.1020%
|
Pure Play
|
Shoals sells electrical balance of system solutions for solar energy projects.
|
||
|
0.2115%
|
Passed Mining Filter
|
Sigma Lithium explores and develops lithium mining sites in Brazil. Lithium is a critical mineral for the energy transition, particularly for batteries.
|
||
|
|
EV Infrastructure
|
Snow Lake Resources Ltd.
|
Failed Market Cap Filter
|
We're keeping an eye on them, but as of last annual rebalance, they fell below our $250m market cap exclusion.
|
|
|
Energy Storage
|
Sociedad Química y Minera de Chile S.A.
|
Lacked Sufficient Information
|
While SQM does mine for some critical minerals, they do not disclose the breakdown between those and others (like gold and silver) so we exclude them for lack of information.
|
|
|
EV Supply Chain
|
SolarBank Corporation
|
Failed Market Cap Filter
|
We're keeping an eye on them, but as of last annual rebalance, they fell below our $250m market cap exclusion.
|
|
0.0966%
|
Pure Play
|
SolarEdge sells DC inverter systems for solar PVs, EV charging solutions, lithium-ion cells and batteries, and power supply solutions.
|
||
|
|
Energy Storage
|
SolarMax Technology, Inc.
|
Failed Market Cap Filter
|
We're keeping an eye on them, but as of last annual rebalance, they fell below our $250m market cap exclusion.
|
|
|
EV Infrastructure
|
 Solid Power, Inc.
|
Failed Market Cap Filter
|
Solid Power is a pure play in energy storage that is developing all-solid-state battery cell technology that replaces the liquid or gel polymer electrolyte in conventional lithium-ion battery cells with a sulfide-based solid electrolyte
|
|
|
Critical Minerals
|
Solidion Technology Inc.
|
Failed Market Cap Filter
|
We're keeping an eye on them, but as of last annual rebalance, they fell below our $250m market cap exclusion.
|
|
|
Plant-based diet
|
 Solitario Zinc Corp.
|
Lacked Sufficient Information
|
XPL is a mineral exploration company. While it does explore for some critical minerals, its main focus is gold which is not a mineral critical to the energy transition.
|
|
5.0000%
|
Passed Mining Filter
|
96% of SCCO's revenue comes from the extraction and sale of the critical minerals: copper, molybdenum, and zinc.
|
||
|
|
Solar, PVs
|
 SPI Energy
|
Failed Market Cap Filter
|
SPI Energy builts solar projects for power producers, owns its own solar projects, and makes EVs and EV charging infrastructure.
|
|
|
Bioplastics
|
 SPRU (XL Fleet)
|
Failed Market Cap Filter
|
Spruce Power sells solar charging of cars a service, as well as battery packs and other key components to clean electrification.
|
|
|
Electrical Utility
|
SRIVARU Holding Limited
|
Failed Market Cap Filter
|
We're keeping an eye on them, but as of last annual rebalance, they fell below our $250m market cap exclusion.
|
|
|
Electric Cars
|
Standard Lithium Ltd.
|
Failed Fraud Filter
|
Standard Lithium failed our fraud filter: https://hindenburgresearch.com/standard-lithium/
|
|
0.0190%
|
Passed Mining Filter
|
Stardust Power Inc. is a vertically-integrated lithium refinery that engages in producing battery-grade lithium. The company was founded in 2022 and is based in Greenwich, Connecticut.
|
||
|
|
Plant-based diet
|
.jpg) Steakholder Foods Ltd (MITC MeaTech 3D)
|
Failed Market Cap Filter
|
Meatech 3D develops cultured meat products without animal slaughtering.
|
|
1.8482%
|
Passed Revenue Filter
|
Steel Dynamics is a steel producer and metal recycler. It produces steel using scrap metal and electric arc furnace technology, which is much more energy efficient than blast furnace.
|
||
|
|
Solar, Hot Water
|
%20Logo.png) Steel Partners Holdings
|
Lacked Sufficient Information
|
Steel partners makes specialty LED lighting, which is a climate solution, but it also makes steel tubing services to oil and gas companies. It doesnÕt provide sufficient information about the revenue breakdown between these end-markets.
|
|
|
Electrical Utility
|
%20Logo.png) Stellantis N.V.
|
Lacked Sufficient Information
|
Stellantis produces some EVs, but they donÕt provide a revenue breakdown between its EV and internal combustion vehicle offerings. We exclude them because they lack sufficient information.
|
|
|
Energy Storage
|
 Stem
|
Failed Market Cap Filter
|
Stem helps buildings to switch from onsite, to stored, to grid electricity with its AI-powered platform.
|
|
|
Wind Power
|
.jpg) Sterling Construction
|
No Drawdown Solution
|
Sterling Construction offers infrastructure & rehabilitation projects for highways, roads, bridges, ports, and other systems. But it doesnÕt makes any leak detection or water conservation technologies.
|
|
0.0570%
|
Pure Play
|
Sunnova is a leading residential solar PV company in the US
|
||
|
0.0919%
|
Pure Play
|
SunOpta sells plant-based foods and beverages from almond, soy, coconut, oat, or hemp.
|
||
|
|
Electric Cars
|
Sunrise New Energy Co., Ltd.
|
Failed Market Cap Filter
|
We're keeping an eye on them, but as of last annual rebalance, they fell below our $250m market cap exclusion.
|
|
0.2518%
|
Pure Play
|
Sunrun sells solar energy systems like panels, and energy storage systems, primarily to residential customers.
|
||
|
|
Critical Minerals
|
Surf Air Mobility Inc.
|
Failed Market Cap Filter
|
We're keeping an eye on them, but as of last annual rebalance, they fell below our $250m market cap exclusion.
|
|
|
Electric Cars
|
 Swvl Holdings Corp.
|
Failed Market Cap Filter
|
Swvl is a mass transit pure play that allow for semi-flexible minibus routes as a ride-sharing option. Swvl is a more flexible alternative to large-scale mass transit and a lower-emissions alternative to cab hailing apps like Uber and Lyft.
|
|
|
Critical Minerals
|
SYLA Technologies Co., Ltd.
|
Failed Market Cap Filter
|
We're keeping an eye on them, but as of last annual rebalance, they fell below our $250m market cap exclusion.
|
|
|
Carbon Management
|
Tantech Holdings Ltd
|
Failed Market Cap Filter
|
We're keeping an eye on them, but as of last annual rebalance, they fell below our $250m market cap exclusion.
|
|
|
Waste To Energy
|
%20Logo.png) Tata Motors
|
Failed Revenue Filter
|
Tata Motors makes some EVs, but these only account for about 23% of its total revenue. It fails our revenue filter.
|
|
|
Critical Minerals
|
 Teck Resources Ltd Class B
|
Failed Mining Filter
|
Despite making a good portion of its revenue from copper and zinc (both critical minerals), Teck owns multiple fossil fuel extraction sites including a tar sands site in Canada. Therefore we exclude it.
|
|
0.3743%
|
Passed Revenue Filter
|
Tecnoglass sells high-performance windows.
|
||
|
5.0000%
|
Pure Play
|
Tesla makes EVs, solar energy generation, and energy storage products.
|
||
|
|
Electric Cars
|
%20Logo.png) Tetra Tech
|
Failed Defense Filter
|
Tetra Tech helps clients achieve net-zero emissions in its buildings. But it also works with many oil and gas companies and does a significant amount of work for militaries. It doesnÕt give a precise revenue breakdown.
|
|
|
Electrical Utility
|
%20Logo.jpg) The AES
|
Failed Utility Filter
|
AES is an electric utility that produces 57% of its power from fossil fuels (including coal) and the rest from renewables. It fails our utility and coal filters.
|
|
0.0517%
|
Passed Revenue Filter
|
Hain sells a variety of plant-based snack products like tortilla chips, whole grain chips, and pita chips, plant-based beverages, plant-based meat-alternative products.
|
||
|
|
Electric Cars
|
 The Lion Electric
|
Failed Market Cap Filter
|
Lion Electric sells all-electric medium and heavy-duty urban vehicles like trucks and buses to electrify mass transportation.
|
|
|
Electrical Utility
|
%20Logo.png) The Southern
|
Failed Utility Filter
|
The Southern is an electrical utility that generates 72% of its power from fossil fuels. It fails our utility filter.
|
|
|
Critical Minerals
|
Thunder Power Holdings, Inc.
|
Failed Market Cap Filter
|
We're keeping an eye on them, but as of last annual rebalance, they fell below our $250m market cap exclusion.
|
|
|
Critical Minerals
|
Tigo Energy, Inc.
|
Failed Market Cap Filter
|
We're keeping an eye on them, but as of last annual rebalance, they fell below our $250m market cap exclusion.
|
|
0.0401%
|
Passed Mining Filter
|
Deep Sea Ocean mining is still in its research phase. It has the promise of being significantly less environmentally impactful than land-based mining for critical minerals as it's largely picking up large, metal-rich rocks from the bottom surface of the ocean. Credible concerns have been raised about TMC and other deep sea mining efforts from groups like Greenpeace. Without a for-profit motive, we do not believe there will be adequate funding to properly vet the full environmental impact of deep sea ocean mining. Given its potential to be significantly less impactful than land-based operations, we decided to include TMC and other Deep Sea Mining companies until the full environmental reviews have been completed.
|
||
|
0.9651%
|
Passed Revenue Filter
|
TopBuild sells insulation products for buidlings
|
||
|
|
Critical Minerals
|
TOYO Co., Ltd.
|
Failed Market Cap Filter
|
We're keeping an eye on them, but as of last annual rebalance, they fell below our $250m market cap exclusion.
|
|
|
LED
|
%20Logo.png) Toyota Motor
|
Failed Revenue Filter
|
Toyota makes some EVs but makes most of its revenue from traditional internal combustion vehicles. It fails our revenue filter.
|
|
|
Wind Power
|
.png) TPI Composites
|
Failed Market Cap Filter
|
TPI makes 96% of its revenue from composite wind blades, related precision molding and assembly systems
|
|
|
Building Automation
|
.png) Trane Technologies
|
Lacked Sufficient Information
|
Trane sells HVAC products, including high-efficiency heat pumps, which are a climate solution. But they donÕt give a revenue breakdown by product. TheyÕre excluded from the Index for lack of sufficient information.
|
|
|
Electrical Utility
|
%20Logo.jpg) TransAlta
|
Failed Utility Filter
|
TransAlta is an electric utility that generates 41.7% of its power from gas and 38.3% from renewables. It fails our utility filter.
|
|
|
Electric Cars
|
Trilogy Metals Inc.
|
Failed Market Cap Filter
|
We're keeping an eye on them, but as of last annual rebalance, they fell below our $250m market cap exclusion.
|
|
|
Critical Minerals
|
 Tronox Holdings PLC
|
Failed Mining Filter
|
Tronox produces titanium dioxide, a pigment for making products white, not a critical mineral.
|
|
|
Industrial Recycling
|
Turbo Energy, S.A. American Depositary Shares
|
Failed Market Cap Filter
|
We're keeping an eye on them, but as of last annual rebalance, they fell below our $250m market cap exclusion.
|
|
|
Nuclear Power
|
.jpg) Tutor Perini
|
Failed Defense Filter
|
Tutor Perini is a construction company. It builds military defense facilities so it fails our defense filter.
|
|
|
Electric Cars
|
U Power Limited
|
Failed Market Cap Filter
|
We're keeping an eye on them, but as of last annual rebalance, they fell below our $250m market cap exclusion.
|
|
|
Electric Cars
|
 U.S. Gold Corp.
|
Failed Mining Filter
|
U.S. Gold Corp. operates as a gold and precious metals exploration company. It explores for gold, copper, silver, and zinc deposits. The company holds interest in the CK Gold project located in the Silver Crown mining district of southeast Wyoming. It also holds interests in the Keystone and Maggie Creek exploration properties located on the Cortez and Carlin Trends in Eureka County, Nevada; and the Challis Gold project located in Idaho. The company is based in Elko, Nevada. U.S. Gold Corp. was a former subsidiary of Copper King, LLC.
|
|
|
Solar, PVs
|
U.S. GoldMining Inc.
|
Failed Market Cap Filter
|
We're keeping an eye on them, but as of last annual rebalance, they fell below our $250m market cap exclusion.
|
|
|
Fuel Cells
|
%20Logo.png) Ultralife
|
Failed Market Cap Filter
|
Ultralife makes a majority of its revenue from EVs and energy storage. But it fails our defense filter because it sells batteries specifically designed for military combat and communications.
|
|
|
Electric Two Wheelers
|
Unifi, Inc.
|
Failed Market Cap Filter
|
We're keeping an eye on them, but as of last annual rebalance, they fell below our $250m market cap exclusion.
|
|
|
Energy Storage
|
%20Logo.png) Unitil
|
Lacked Sufficient Information
|
Until makes roughly equal amount of revenue from electric and gas distribution. But itÕs not clear how much of its electricity purchase is in the form of renewable energy certificates. We exclude it for lacking sufficient information.
|
|
|
Nuclear Power
|
Universal Stainless & Alloy Products, Inc.
|
Lacked Sufficient Information
|
Universal Stainless is a steel maker that recycles scrap metal from its own production. But they don't disclose how much of its raw material is scrap metal, so they’re excluded for lack of sufficient information.
|
|
0.0641%
|
Pure Play
|
Ur-Energy explores uranium mineral properties in 12 projects in the US.
|
||
|
0.3316%
|
Pure Play
|
Uranium Energy extracts and processes uranium.
|
||
|
0.0446%
|
Passed Mining Filter
|
Uranium Royalty is a pure-play uranium mining company that primarily mines for uranium in Canada. Uranium is needed to power nuclear energy, a fossil-fuel free power source.
|
||
|
|
EV Infrastructure
|
US Antimony
|
Failed Market Cap Filter
|
We're keeping an eye on them, but as of last annual rebalance, they fell below our $250m market cap exclusion.
|
|
0.6310%
|
Passed Revenue Filter
|
Valmont makes irrigation efficiency and grid flexibility solutions, both of which are climate solutions.
|
||
|
|
Energy Storage
|
Vast Renewables Limited
|
Failed Market Cap Filter
|
We're keeping an eye on them, but as of last annual rebalance, they fell below our $250m market cap exclusion.
|
|
|
Alternative Cement
|
.jpg) Veeco Instruments
|
Lacked Sufficient Information
|
Veeco makes semiconductors and thin film process equipment, with applications in solar PVs and LEDs. But since they donÕt provide a revenue breakdown, we exclude them for lack of sufficient information.
|
|
|
Electric Aviation
|
Verde Clean Fuels, Inc.
|
Failed Market Cap Filter
|
We're keeping an eye on them, but as of last annual rebalance, they fell below our $250m market cap exclusion.
|
|
|
Electric Cars
|
Vertex Energy, Inc.
|
Failed Market Cap Filter
|
We're keeping an eye on them, but as of last annual rebalance, they fell below our $250m market cap exclusion.
|
|
|
Solar, PVs
|
Vertical Aerospace Ltd.
|
Failed Market Cap Filter
|
We're keeping an eye on them, but as of last annual rebalance, they fell below our $250m market cap exclusion.
|
|
|
Wind Power
|
%20Logo.png) Vertiv Holdings
|
Failed Revenue Filter
|
Vertiv helps improve grid flexibility, but it has customers in the oil and gas industry. ItÕs not clear how much revenue they get from these customers.
|
|
|
Insulation
|
%20Logo.jpg) Via Renewables
|
Failed Utility Filter
|
Via Renewables is a retail distributor of electricity and gas. But it doesnÕt give information about the sources of the electricity it purchases. We exclude it for lacking sufficient information.
|
|
|
Electric Boats
|
Vicinity Motor Corp.
|
Failed Market Cap Filter
|
We're keeping an eye on them, but as of last annual rebalance, they fell below our $250m market cap exclusion.
|
|
|
Mass Transit
|
%20Logo.jpg) Vicor
|
Failed Defense Filter
|
Vicor sells defense electronics used in airborne, seaborne, or field communications and radar, which fails our defense filter.
|
|
|
Methane Capture
|
.jpg) Village Farms International
|
Failed Revenue Filter
|
Village Farms operates a methane digester power plant and sells the electricity it generates. But since this accounts for less than 1% of its total revenue, it fails our revenue filter.
|
|
1.0529%
|
Pure Play
|
VinFast is a Vietnamese electric car manufacturer that generates all of its revenue from developing and selling EVs
|
||
|
|
Solar, Pvs
|
Vision Marine Technologies Inc.
|
Failed Market Cap Filter
|
We're keeping an eye on them, but as of last annual rebalance, they fell below our $250m market cap exclusion.
|
|
|
Electrical Utility
|
%20Logo.jpg) Vistra
|
Failed Utility Filter
|
Vista is an electric utility that generates ~93% of its power from fossil fuels, including coal. It fails our utility and coal filters.
|
|
|
Plant-based diet
|
 Vita Coco Co Inc
|
Failed Plant-Based Diet Filter
|
Vita Coco sells coconut water in different variations. But since its products arenÕt replacements to meat-based foods, it fails the plant-based food filter.
|
|
|
Net-zero building
|
.png) Vivint Smart Home
|
Lacks Proper Information
|
Vivint sells cloud-enabled smart home operating systems that enable homeowners to run its HVAC and other systems with less energy. But it doesnÕt give a revenue breakdown between its products.
|
|
|
Electrical Utility
|
 VivoPower International
|
Failed Market Cap Filter
|
Vivo Power provides EVs, critical power services, battery and microgrid technology and solar power. These products and services account for nearly 100% of its revenue.
|
|
|
Telepresence
|
 Volcon
|
Failed Market Cap Filter
|
Volcon is an electric car pure play that builds electric motorcycles, off-road powersports vehicles, and utility terrain vehicles.
|
|
|
Electric Two Wheelers
|
 Wallbox NV
|
Failed Market Cap Filter
|
Wallbox is an EV infrastructure pure play that makes EV charging systems that allow communication between user, vehicle, grid, building and charger.
|
|
4.5415%
|
Passed Landfill Filter
|
Azure Power is an electric utility that is focused on generating clean electricity. 100% of Azure Power's revenue comes from generating renewable power.
|
||
|
5.0000%
|
Passed Landfill Filter
|
Waste Management has methane capture systems at 144 out of 260 landfill in operations. Since it has methane capture systems at more than 50% of these landfill sites, WM passes our landfill filter.
|
||
|
|
Smartgrid
|
Watsco, Inc.
|
Failed Revenue Filter
|
Watsco is a large US-based retailer that contractors use for HVAC systems. They sold about 8.7 million HVAC units but only about 1.5 million were heat pumps or high efficiency ductless, so they do not pass our revenue filter.
|
|
0.6889%
|
Passed Revenue Filter
|
Watts makes 52% of its revenue from residential and commercial leak detection and water quality monitoring products
|
||
|
|
Electrical Utility
|
%20Logo.jpg) WEC Energy Group
|
Failed Utility Filter
|
WEC is an electric utility that generates 89% of its power from fossil fuels, including coal. It fails our utility and coal filters.
|
|
|
Grid Expansion
|
.png) WESCO International
|
Failed Revenue Filter
|
WESCO sells basic grid upgrade equipment, smart grid products, transformers and distribution hardware, but these products only account for 26.8% of its total revenue. It fails our revenue filter.
|
|
|
Smart Thermostat
|
 Westinghouse Air Brake Technologies
|
Failed Revenue Filter
|
WAB makes products for locomotives, freight cars and passenger transit vehicles. ItÕs not clear how much revenue it gets from particular products, so we exclude it for lacking sufficient information.
|
|
|
SmartGrid
|
 Westwater Resources
|
Failed Market Cap Filter
|
Westwater Resources is a pure play in battery-ready graphite materials, a key component in battery construction.
|
|
|
Water Distribution
|
%20Logo.jpg) Whole Earth Brands
|
No Drawdown Solution
|
Whole Earth Brands makes plant-based consumer packaged goods, but it also makes flavored products used by the tobacco industry, thus failing the tobacco filter
|
|
0.0552%
|
Passed Revenue Filter
|
Wildan provides consulting services to help clients achieve its energy efficiency goals, grid optimization, emissions reduction, and building retrofits.
|
||
|
|
Recycling
|
 Workhorse Group
|
Failed Fraud Filter
|
Workhorse is an EV manufacturer but is currently under investigation for insider trading. We exclude them because it fails our fraud filter.
|
|
|
Electrical Utility
|
%20Logo.png) Xcel Energy
|
Failed Utility Filter
|
Xcel is an electric utility that generates 51% of its power from fossil fuels, including coal. It fails our utility and coal filters.
|
|
|
Recycling
|
 Xos, Inc.
|
Failed Market Cap Filter
|
XOS Truck is an EV pure play that makes electric drivetrains for trucks as well as medium- and heavy-duty electric trucks.
|
|
0.9328%
|
Pure Play
|
XPeng sells EVs, including sedans, for the Chinese market.
|
||
|
|
Water Distribution
|
 Xylem
|
Failed Revenue Filter
|
Xylem makes water leak detection and remote monitoring solutions, but these account for much less than 50% of its total revenue. It fails our revenue filter.
|
|
|
Electric Trains
|
Zapp Electric Vehicles Group Limited
|
Failed Market Cap Filter
|
We're keeping an eye on them, but as of last annual rebalance, they fell below our $250m market cap exclusion.
|
|
0.7102%
|
Pure Play
|
ZEEKR is a Chinese manufacturer of electric cars and electric car parts like drivetrains.
|
||
|
|
Electric Cars
|
Zeo Energy Corp.
|
Failed Market Cap Filter
|
We're keeping an eye on them, but as of last annual rebalance, they fell below our $250m market cap exclusion.
|
|
2.5823%
|
Pure Play
|
Zoom offers video, phone, and chat communications technology and services.
|
||
|
|
Energy Storage
|
ZOOZ Power Ltd.
|
Failed Market Cap Filter
|
We're keeping an eye on them, but as of last annual rebalance, they fell below our $250m market cap exclusion.
|
%20Logo.jpg)


%20Logo.jpg)
.jpg)
%20Logo.png)


%20Logo.png)
%20Logo.jpg)
%20Logo.png)
%20Logo.jpg)
.png)
.jpg)
%20Logo.png)
%20Logo.png)

%20Logo.png)


.jpg)
%20Logo.png)
.png)
.jpg)
%20Logo.jpg)
.png)
.jpg)
%20Logo.jpg)
%20Logo.png)

.png)
%20Logo.png)
%20Logo.png)

%20Logo.jpg)
.png)
.jpg)

%20Logo.png)

%20Logo.png)
%20Logo.png)


%20Logo.jpeg)
%20Logo.png)

%20Logo.png)
.png)

%20Logo.jpg)
.png)


%20Logo.png)
%20Logo.png)
%20Logo.jpg)

.png)
%20Logo.png)
%20Logo.png)
%20Logo.jpg)
%20Logo.png)
%20Logo.png)
.png)


%20Logo.jpg)
%20Logo.jpg)
%20Logo.jpg)
.jpg)
%20Logo.png)
%20Logo.jpg)
%20Logo.png)
%20Logo.png)


%20Logo.png)
%20Logo.png)

%20Logo.jpg)
%20Logo.png)
%20Logo.png)
%20Logo.jpg)
.png)


%20Logo.png)
%20Logo.jpg)

%20Logo.png)
%20Logo.jpg)
%20Logo.png)


%20Logo.png)
.png)

%20Logo.jpg)
%20Logo.png)
%20Logo.png)
%20Logo.jpg)
%20Logo.png)
.png)


%20Logo.jpg)
%20Logo.png)
%20Logo.jpg)
%20Logo.jpg)

%20Logo.png)
%20Logo.png)
%20Logo.jpg)


%20Logo.png)
%20Logo.jpg)


%20Logo.png)
%20Logo.png)
%20Logo.jpg)

.jpg)
%20Logo.png)

.jpg)
.jpg)
%20Logo.png)
.png)
%20Logo.jpg)
.jpg)
.jpg)

%20Logo.jpg)

%20Logo.png)

%20Logo.jpg)

.png)

%20Logo.jpg)

.png)

%20Logo.png)
.png)
%20Logo.gif)
%20Logo.jpg)

%20Logo.jpg)
.png)


%20Logo.jpg)


.png)
%20Logo.png)
%20Logo.jpg)


%20Logo.jpg)
%20Logo.png)
%20Logo.png)
%20Logo.png)
%20Logo.jpg)
.png)
%20Logo.png)
%20Logo.jpg)


.png)
.png)
%20Logo.png)
.jpg)
.jpg)


.jpg)
%20Logo.png)
%20Logo.png)

.jpg)

%20Logo.png)

%20Logo.png)
%20Logo.jpg)

%20Logo.png)
%20Logo.png)
.png)
.png)
%20Logo.jpg)

.jpg)

%20Logo.png)
%20Logo.png)
.jpg)
%20Logo.png)
%20Logo.jpg)
%20Logo.jpg)
.jpg)
%20Logo.jpg)

.png)


%20Logo.jpg)
.png)


%20Logo.jpg)

%20Logo.png)


%20Logo.jpg)


%20Logo.jpg)
.jpg)
%20Logo.png)


%20Logo.png)
%20Logo.jpg)
%20Logo.png)
%20Logo.jpg)
.png)
.jpg)
%20Logo.png)
%20Logo.png)

%20Logo.png)


.jpg)
%20Logo.png)
.png)
.jpg)
%20Logo.jpg)
.png)
.jpg)
%20Logo.jpg)
%20Logo.png)

.png)
%20Logo.png)
%20Logo.png)

%20Logo.jpg)
.png)
.jpg)

%20Logo.png)

%20Logo.png)
%20Logo.png)


%20Logo.jpeg)
%20Logo.png)

%20Logo.png)
.png)

%20Logo.jpg)
.png)


%20Logo.png)
%20Logo.png)
%20Logo.jpg)

.png)
%20Logo.png)
%20Logo.png)
%20Logo.jpg)
%20Logo.png)
%20Logo.png)
.png)


%20Logo.jpg)
%20Logo.jpg)
%20Logo.jpg)
.jpg)
%20Logo.png)
%20Logo.jpg)
%20Logo.png)
%20Logo.png)


%20Logo.png)
%20Logo.png)

%20Logo.jpg)
%20Logo.png)
%20Logo.png)
%20Logo.jpg)
.png)


%20Logo.png)
%20Logo.jpg)

%20Logo.png)
%20Logo.jpg)
%20Logo.png)


%20Logo.png)
.png)

%20Logo.jpg)
%20Logo.png)
%20Logo.png)
%20Logo.jpg)
%20Logo.png)
.png)


%20Logo.jpg)
%20Logo.png)
%20Logo.jpg)
%20Logo.jpg)

%20Logo.png)
%20Logo.png)
%20Logo.jpg)


%20Logo.png)
%20Logo.jpg)


%20Logo.png)
%20Logo.png)
%20Logo.jpg)

.jpg)
%20Logo.png)

.jpg)
.jpg)
%20Logo.png)
.png)
%20Logo.jpg)
.jpg)
.jpg)

%20Logo.jpg)

%20Logo.png)

%20Logo.jpg)

.png)

%20Logo.jpg)

.png)

%20Logo.png)
.png)
%20Logo.gif)
%20Logo.jpg)

%20Logo.jpg)
.png)


%20Logo.jpg)


.png)
%20Logo.png)
%20Logo.jpg)


%20Logo.jpg)
%20Logo.png)
%20Logo.png)
%20Logo.png)
%20Logo.jpg)
.png)
%20Logo.png)
%20Logo.jpg)


.png)
.png)
%20Logo.png)
.jpg)
.jpg)


.jpg)
%20Logo.png)
%20Logo.png)

.jpg)

%20Logo.png)

%20Logo.png)
%20Logo.jpg)

%20Logo.png)
%20Logo.png)
.png)
.png)
%20Logo.jpg)

.jpg)

%20Logo.png)
%20Logo.png)
.jpg)
%20Logo.png)
%20Logo.jpg)
%20Logo.jpg)
.jpg)
%20Logo.jpg)

.png)


%20Logo.jpg)
.png)


%20Logo.jpg)

%20Logo.png)


Historical Performance
Portfolio type:
Just the climate index & green bonds
Just the climate index & green bonds
Just the climate index & green bonds
Just the climate index & green bonds
Just the climate index & green bonds
Just the climate index & green bonds
Select portfolio:
- Bold (80/20)
- Cautious (50/50)
- Moderately Bold (70/30)
- Moderately Cautious (60/40)
- Most Cautious (40/60)
- Most bold (90/10)
80% stocks, 18% bonds, 2% cash
50% stocks, 48% bonds, 2% cash
70% stocks, 28% bonds, 2% cash
60% stocks, 38% bonds, 2% cash
40% stocks, 58% bonds, 2% cash
90% stocks, 8% bonds, 2% cash
Total return:
Carbon Collective: 96.83%
Index: 56.74%
Jun 30, 2017 - Jun 30, 2022
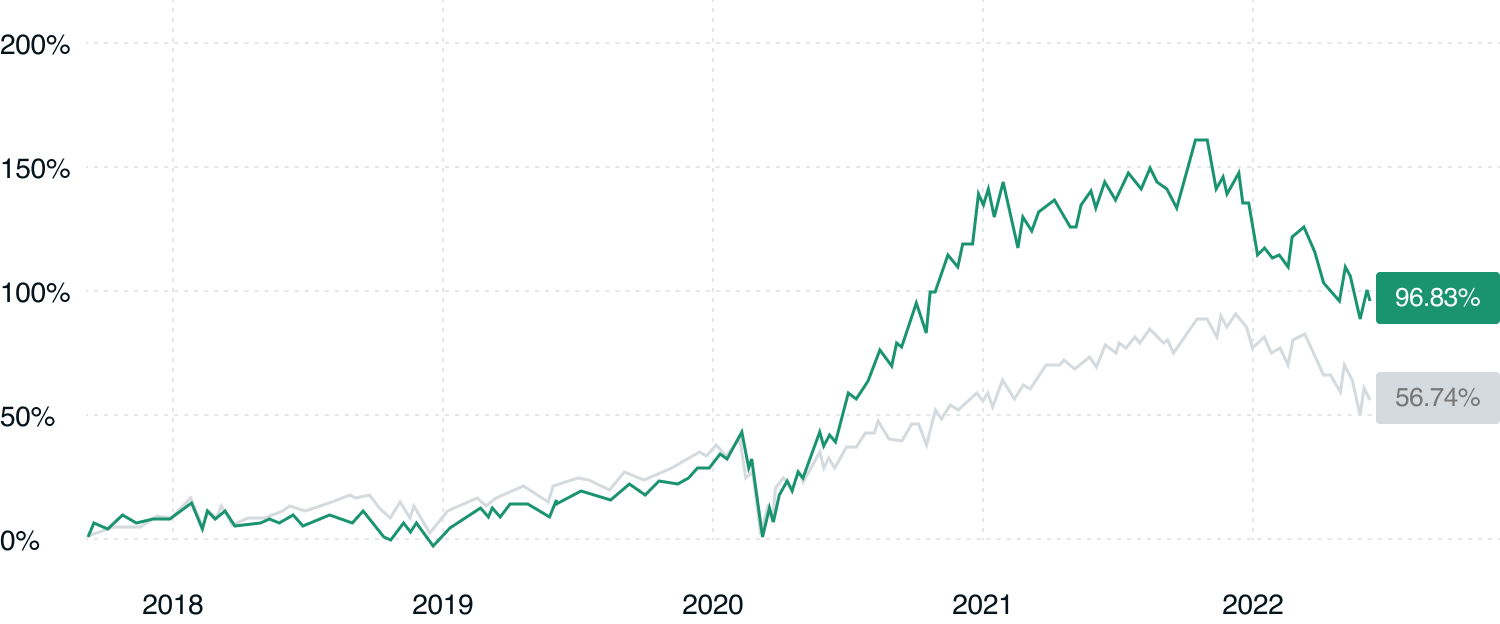

Disclosures
This data compares the selected Carbon Collective portfolio to the comparable blended US benchmark. For example, a 90% stock, 10% bond CC portfolio is compared to the 90/10 US stock/bond benchmark. Carbon Collective’s results include fees (0.25% annually) and assume reinvested dividends. The benchmark reflects a blend of the VTI and BND ETFs and therefore includes the actual expenses of those ETFs during the time period. Performance of all Carbon Collective portfolios from 01/01/2015 - 10/18/20 are backtested, rebalancing on the first day of each year as if our climate-forward strategy had been launched in 2015. See the full details of how we simulate historical performance. Performance of Carbon Collective portfolios after 10/18/20 are simulated performance net of Carbon Collective’s fees and expenses of any underlying ETF included in the portfolios.
Simulated performance, nor past performance are a guarantee of future returns. Investments involve risks and there is always the potential of losing money when you invest in securities.
Total return:
Carbon Collective: 57.82%
Index: 35.95%
Jun 30, 2017 - Jun 30, 2022
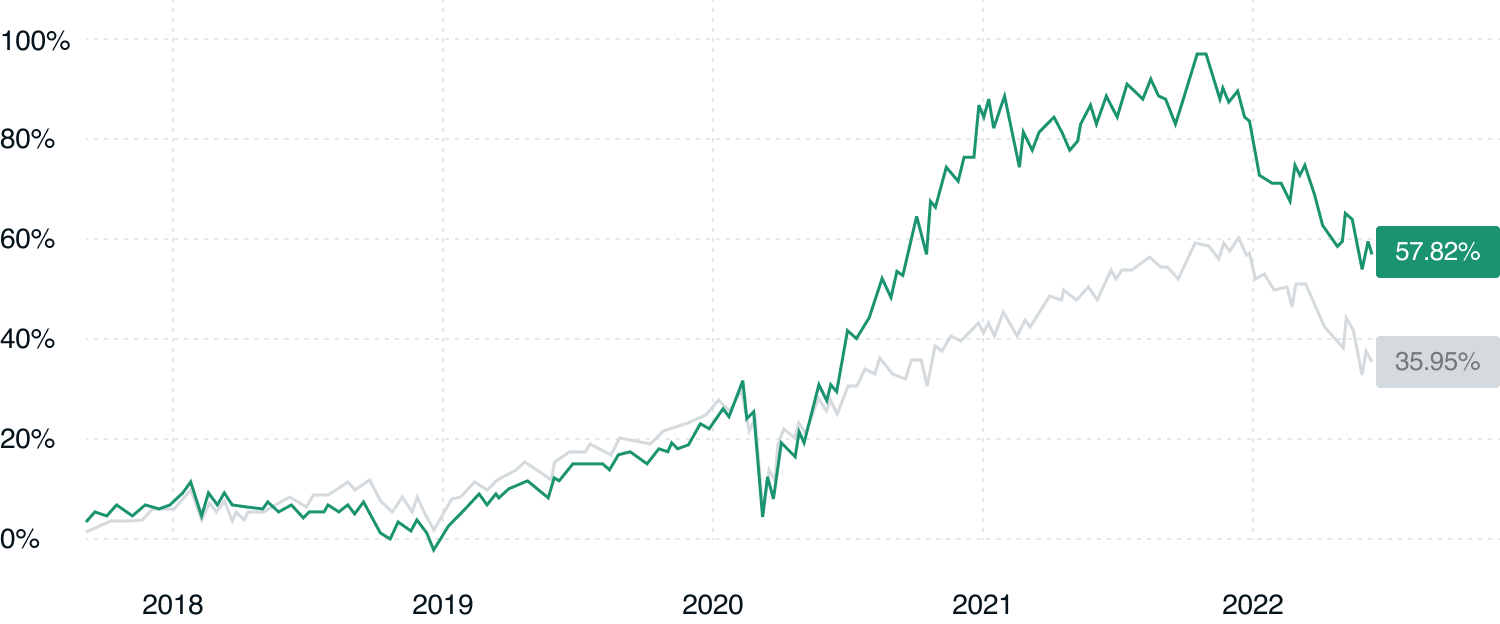

Disclosures
This data compares the selected Carbon Collective portfolio to the comparable blended US benchmark. For example, a 90% stock, 10% bond CC portfolio is compared to the 90/10 US stock/bond benchmark. Carbon Collective’s results include fees (0.25% annually) and assume reinvested dividends. The benchmark reflects a blend of the VTI and BND ETFs and therefore includes the actual expenses of those ETFs during the time period. Performance of all Carbon Collective portfolios from 01/01/2015 - 10/18/20 are backtested, rebalancing on the first day of each year as if our climate-forward strategy had been launched in 2015. See the full details of how we simulate historical performance. Performance of Carbon Collective portfolios after 10/18/20 are simulated performance net of Carbon Collective’s fees and expenses of any underlying ETF included in the portfolios.
Simulated performance, nor past performance are a guarantee of future returns. Investments involve risks and there is always the potential of losing money when you invest in securities.
Total return:
Carbon Collective: 83.93%
Index: 49.69%
Jun 30, 2017 - Jun 30, 2022
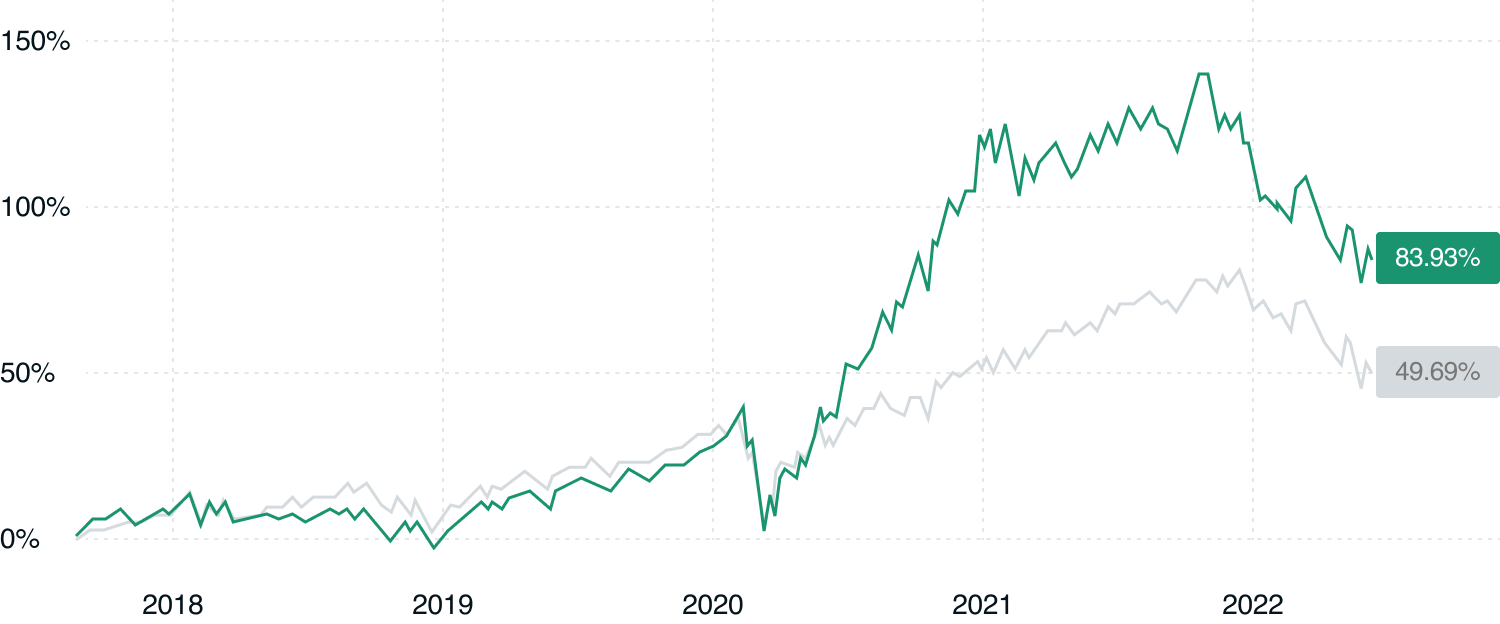

Disclosures
This data compares the selected Carbon Collective portfolio to the comparable blended US benchmark. For example, a 90% stock, 10% bond CC portfolio is compared to the 90/10 US stock/bond benchmark. Carbon Collective’s results include fees (0.25% annually) and assume reinvested dividends. The benchmark reflects a blend of the VTI and BND ETFs and therefore includes the actual expenses of those ETFs during the time period. Performance of all Carbon Collective portfolios from 01/01/2015 - 10/18/20 are backtested, rebalancing on the first day of each year as if our climate-forward strategy had been launched in 2015. See the full details of how we simulate historical performance. Performance of Carbon Collective portfolios after 10/18/20 are simulated performance net of Carbon Collective’s fees and expenses of any underlying ETF included in the portfolios.
Simulated performance, nor past performance are a guarantee of future returns. Investments involve risks and there is always the potential of losing money when you invest in securities.
Total return:
Carbon Collective: 70.15%
Index: 42.76%
Jun 30, 2017 - Jun 30, 2022
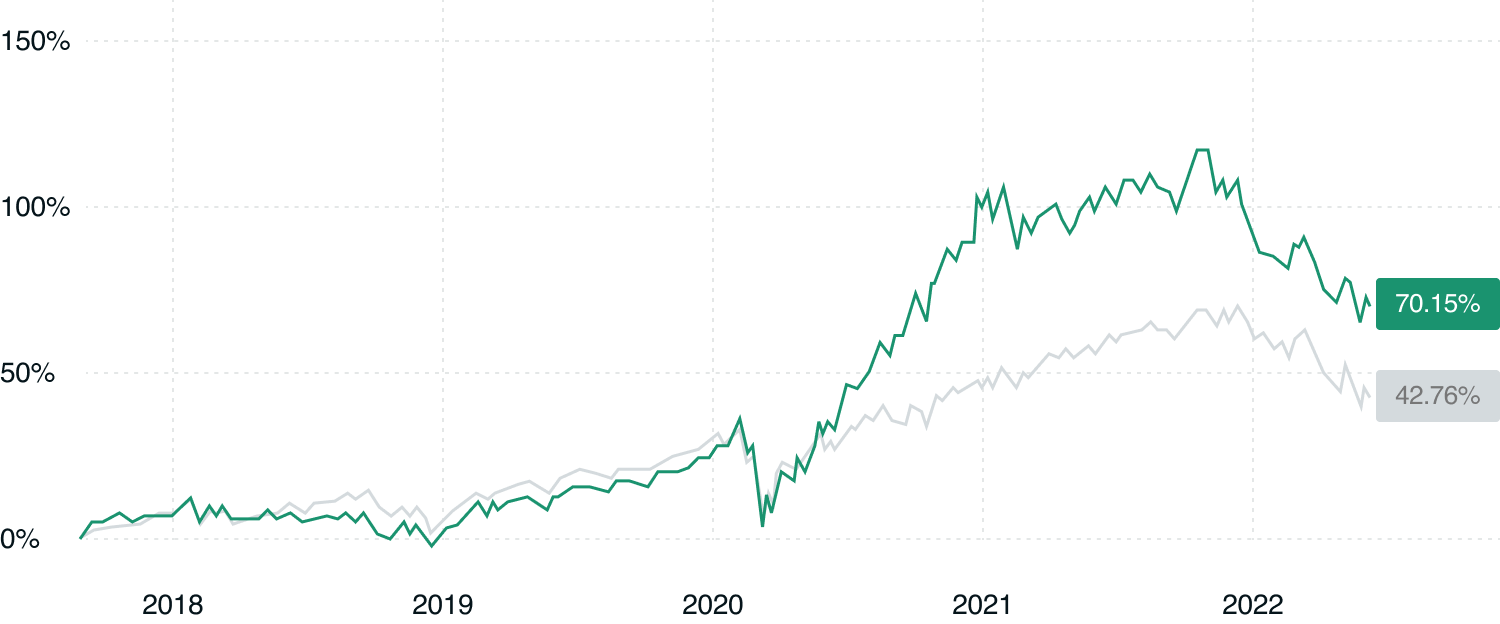

Disclosures
This data compares the selected Carbon Collective portfolio to the comparable blended US benchmark. For example, a 90% stock, 10% bond CC portfolio is compared to the 90/10 US stock/bond benchmark. Carbon Collective’s results include fees (0.25% annually) and assume reinvested dividends. The benchmark reflects a blend of the VTI and BND ETFs and therefore includes the actual expenses of those ETFs during the time period. Performance of all Carbon Collective portfolios from 01/01/2015 - 10/18/20 are backtested, rebalancing on the first day of each year as if our climate-forward strategy had been launched in 2015. See the full details of how we simulate historical performance. Performance of Carbon Collective portfolios after 10/18/20 are simulated performance net of Carbon Collective’s fees and expenses of any underlying ETF included in the portfolios.
Simulated performance, nor past performance are a guarantee of future returns. Investments involve risks and there is always the potential of losing money when you invest in securities.
Total return:
Carbon Collective: 44.86%
Index: 29.29%
Jun 30, 2017 - Jun 30, 2022
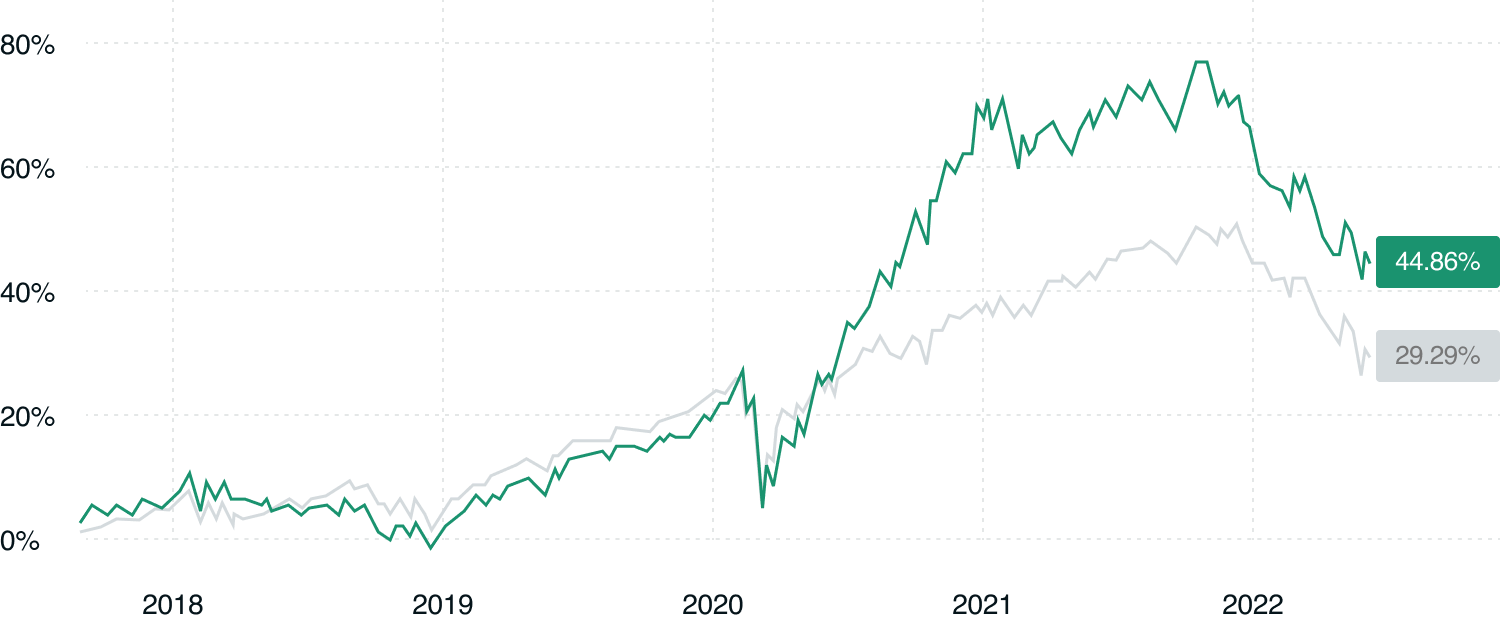

Disclosures
This data compares the selected Carbon Collective portfolio to the comparable blended US benchmark. For example, a 90% stock, 10% bond CC portfolio is compared to the 90/10 US stock/bond benchmark. Carbon Collective’s results include fees (0.25% annually) and assume reinvested dividends. The benchmark reflects a blend of the VTI and BND ETFs and therefore includes the actual expenses of those ETFs during the time period. Performance of all Carbon Collective portfolios from 01/01/2015 - 10/18/20 are backtested, rebalancing on the first day of each year as if our climate-forward strategy had been launched in 2015. See the full details of how we simulate historical performance. Performance of Carbon Collective portfolios after 10/18/20 are simulated performance net of Carbon Collective’s fees and expenses of any underlying ETF included in the portfolios.
Simulated performance, nor past performance are a guarantee of future returns. Investments involve risks and there is always the potential of losing money when you invest in securities.
Total return:
Carbon Collective: 109.57%
Index: 63.89%
Jun 30, 2017 - Jun 30, 2022
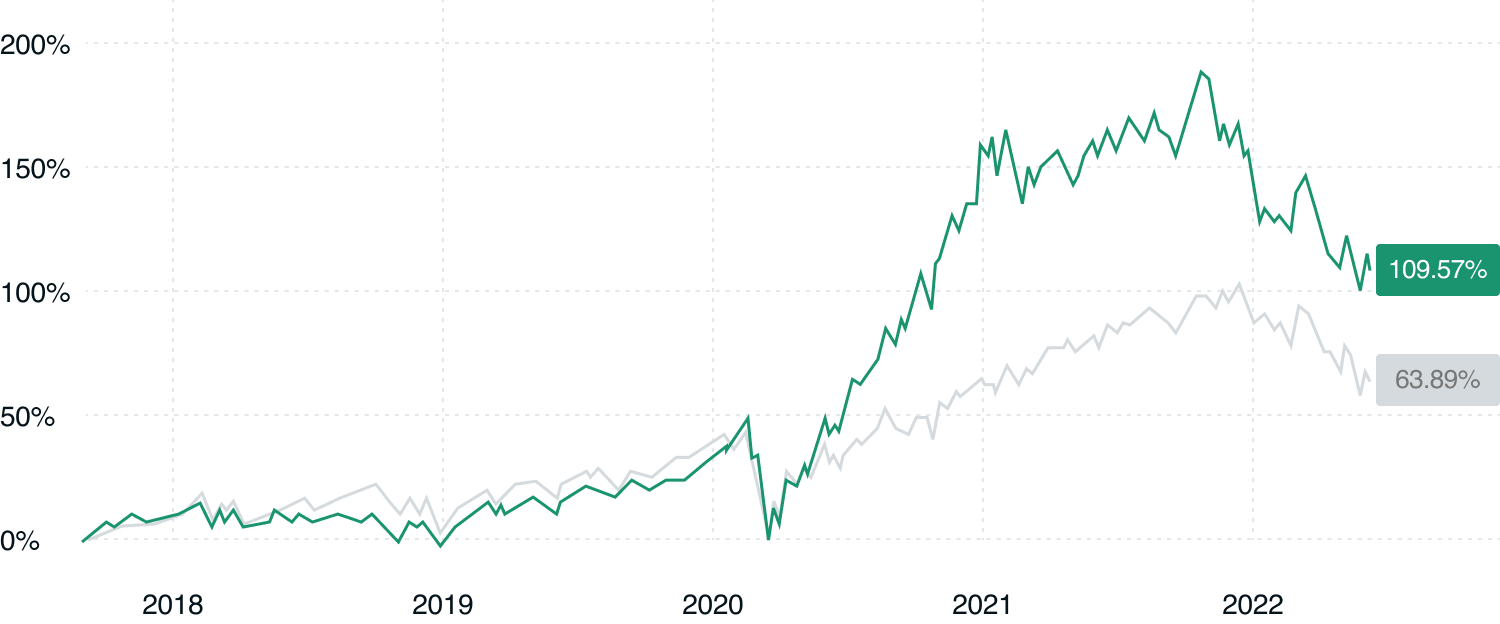

Disclosures
This data compares the selected Carbon Collective portfolio to the comparable blended US benchmark. For example, a 90% stock, 10% bond CC portfolio is compared to the 90/10 US stock/bond benchmark. Carbon Collective’s results include fees (0.25% annually) and assume reinvested dividends. The benchmark reflects a blend of the VTI and BND ETFs and therefore includes the actual expenses of those ETFs during the time period. Performance of all Carbon Collective portfolios from 01/01/2015 - 10/18/20 are backtested, rebalancing on the first day of each year as if our climate-forward strategy had been launched in 2015. See the full details of how we simulate historical performance. Performance of Carbon Collective portfolios after 10/18/20 are simulated performance net of Carbon Collective’s fees and expenses of any underlying ETF included in the portfolios.
Simulated performance, nor past performance are a guarantee of future returns. Investments involve risks and there is always the potential of losing money when you invest in securities.
Jun 30, 2017 - Jun 30, 2022
BENCHMARK
Annual Return
14.49%
9.39%
Risk (STD)
17.70%
13.80%
Max Drawdown
-29.90%
-27.80%
Recovery (Days)
77
134
Beta
0.88
0.81
Alpha
4.34%
-0.14%
Current Yield
1.48%
-

Disclosures
This data compares the selected Carbon Collective portfolio to the comparable blended US benchmark. For example, a 90% stock, 10% bond CC portfolio is compared to the 90/10 US stock/bond benchmark. Carbon Collective’s results include fees (0.25% annually) and assume reinvested dividends. The benchmark reflects a blend of the VTI and BND ETFs and therefore includes the actual expenses of those ETFs during the time period. Performance of all Carbon Collective portfolios from 01/01/2015 - 10/18/20 are backtested, rebalancing on the first day of each year as if our climate-forward strategy had been launched in 2015. See the full details of how we simulate historical performance. Performance of Carbon Collective portfolios after 10/18/20 are simulated performance net of Carbon Collective’s fees and expenses of any underlying ETF included in the portfolios.
Simulated performance, nor past performance are a guarantee of future returns. Investments involve risks and there is always the potential of losing money when you invest in securities.
Jun 30, 2017 - Jun 30, 2022
BENCHMARK
Annual Return
9.54%
6.33%
Beta
0.6
0.53
Alpha
2.19%
-0.34%
Max Drawdown
-22.40%
-18.30%
Current Yield
1.69%
-
Risk (STD)
12.20%
9.10%
Recovery (Days)
-
77

Disclosures
This data compares the selected Carbon Collective portfolio to the comparable blended US benchmark. For example, a 90% stock, 10% bond CC portfolio is compared to the 90/10 US stock/bond benchmark. Carbon Collective’s results include fees (0.25% annually) and assume reinvested dividends. The benchmark reflects a blend of the VTI and BND ETFs and therefore includes the actual expenses of those ETFs during the time period. Performance of all Carbon Collective portfolios from 01/01/2015 - 10/18/20 are backtested, rebalancing on the first day of each year as if our climate-forward strategy had been launched in 2015. See the full details of how we simulate historical performance. Performance of Carbon Collective portfolios after 10/18/20 are simulated performance net of Carbon Collective’s fees and expenses of any underlying ETF included in the portfolios.
Simulated performance, nor past performance are a guarantee of future returns. Investments involve risks and there is always the potential of losing money when you invest in securities.
Jun 30, 2017 - Jun 30, 2022
BENCHMARK
Annual Return
12.95%
8.39%
Risk (STD)
15.80%
12.20%
Alpha
3.71%
-0.21%
Max Drawdown
-26.90%
-24.70%
Beta
0.78
0.72
Recovery (Days)
77
121
Current Yield
1.55%
-

Disclosures
This data compares the selected Carbon Collective portfolio to the comparable blended US benchmark. For example, a 90% stock, 10% bond CC portfolio is compared to the 90/10 US stock/bond benchmark. Carbon Collective’s results include fees (0.25% annually) and assume reinvested dividends. The benchmark reflects a blend of the VTI and BND ETFs and therefore includes the actual expenses of those ETFs during the time period. Performance of all Carbon Collective portfolios from 01/01/2015 - 10/18/20 are backtested, rebalancing on the first day of each year as if our climate-forward strategy had been launched in 2015. See the full details of how we simulate historical performance. Performance of Carbon Collective portfolios after 10/18/20 are simulated performance net of Carbon Collective’s fees and expenses of any underlying ETF included in the portfolios.
Simulated performance, nor past performance are a guarantee of future returns. Investments involve risks and there is always the potential of losing money when you invest in securities.
Jun 30, 2017 - Jun 30, 2022
BENCHMARK
Risk (STD)
14.00%
10.60%
Beta
0.69
0.62
Max Drawdown
-24.40%
-21.50%
Recovery (Days)
-
119
Annual Return
11.20%
7.37%
Alpha
2.90%
-0.28%
Current Yield
1.62%
-

Disclosures
This data compares the selected Carbon Collective portfolio to the comparable blended US benchmark. For example, a 90% stock, 10% bond CC portfolio is compared to the 90/10 US stock/bond benchmark. Carbon Collective’s results include fees (0.25% annually) and assume reinvested dividends. The benchmark reflects a blend of the VTI and BND ETFs and therefore includes the actual expenses of those ETFs during the time period. Performance of all Carbon Collective portfolios from 01/01/2015 - 10/18/20 are backtested, rebalancing on the first day of each year as if our climate-forward strategy had been launched in 2015. See the full details of how we simulate historical performance. Performance of Carbon Collective portfolios after 10/18/20 are simulated performance net of Carbon Collective’s fees and expenses of any underlying ETF included in the portfolios.
Simulated performance, nor past performance are a guarantee of future returns. Investments involve risks and there is always the potential of losing money when you invest in securities.
Jun 30, 2017 - Jun 30, 2022
BENCHMARK
Annual Return
7.68%
5.27%
Alpha
1.36%
-0.41%
Max Drawdown
-20.30%
-16.10%
Recovery (Days)
-
-
Risk (STD)
10.30%
7.70%
Beta
0.5
0.43
Current Yield
1.74%
-

Disclosures
This data compares the selected Carbon Collective portfolio to the comparable blended US benchmark. For example, a 90% stock, 10% bond CC portfolio is compared to the 90/10 US stock/bond benchmark. Carbon Collective’s results include fees (0.25% annually) and assume reinvested dividends. The benchmark reflects a blend of the VTI and BND ETFs and therefore includes the actual expenses of those ETFs during the time period. Performance of all Carbon Collective portfolios from 01/01/2015 - 10/18/20 are backtested, rebalancing on the first day of each year as if our climate-forward strategy had been launched in 2015. See the full details of how we simulate historical performance. Performance of Carbon Collective portfolios after 10/18/20 are simulated performance net of Carbon Collective’s fees and expenses of any underlying ETF included in the portfolios.
Simulated performance, nor past performance are a guarantee of future returns. Investments involve risks and there is always the potential of losing money when you invest in securities.
Jun 30, 2017 - Jun 30, 2022
BENCHMARK
Annual Return
15.93%
10.37%
Risk (STD)
19.70%
15.30%
Alpha
4.87%
-0.07%
Max Drawdown
-32.90%
-30.80%
Recovery (Days)
77
136
Current Yield
1.40%
-
Beta
0.98
0.91

Disclosures
This data compares the selected Carbon Collective portfolio to the comparable blended US benchmark. For example, a 90% stock, 10% bond CC portfolio is compared to the 90/10 US stock/bond benchmark. Carbon Collective’s results include fees (0.25% annually) and assume reinvested dividends. The benchmark reflects a blend of the VTI and BND ETFs and therefore includes the actual expenses of those ETFs during the time period. Performance of all Carbon Collective portfolios from 01/01/2015 - 10/18/20 are backtested, rebalancing on the first day of each year as if our climate-forward strategy had been launched in 2015. See the full details of how we simulate historical performance. Performance of Carbon Collective portfolios after 10/18/20 are simulated performance net of Carbon Collective’s fees and expenses of any underlying ETF included in the portfolios.
Simulated performance, nor past performance are a guarantee of future returns. Investments involve risks and there is always the potential of losing money when you invest in securities.
Portfolio type:
Just the climate index & green bonds
Just the climate index & green bonds
Just the climate index & green bonds
Just the climate index & green bonds
Just the climate index & green bonds
Just the climate index & green bonds
Select portfolio:
- Bold (80/20)
- Cautious (50/50)
- Moderately Bold (70/30)
- Moderately Cautious (60/40)
- Most Cautious (40/60)
- Most bold (90/10)
80% stocks, 18% bonds, 2% cash
50% stocks, 48% bonds, 2% cash
70% stocks, 28% bonds, 2% cash
60% stocks, 38% bonds, 2% cash
40% stocks, 58% bonds, 2% cash
90% stocks, 8% bonds, 2% cash
Total return:
Carbon Collective: 96.83%
Index: 56.74%
Jun 30, 2017 - Jun 30, 2022
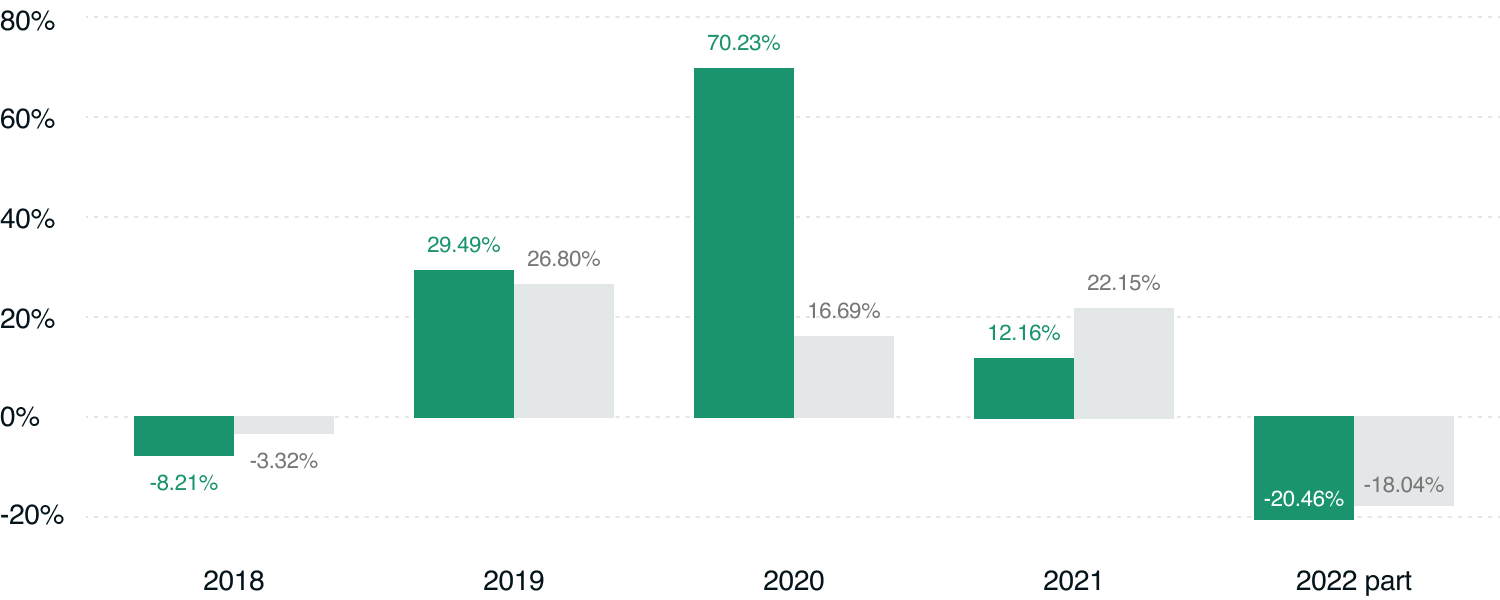

Disclosures
This data compares the selected Carbon Collective portfolio to the comparable blended US benchmark. For example, a 90% stock, 10% bond CC portfolio is compared to the 90/10 US stock/bond benchmark. Carbon Collective’s results include fees (0.25% annually) and assume reinvested dividends. The benchmark reflects a blend of the VTI and BND ETFs and therefore includes the actual expenses of those ETFs during the time period. Performance of all Carbon Collective portfolios from 01/01/2015 - 10/18/20 are backtested, rebalancing on the first day of each year as if our climate-forward strategy had been launched in 2015. See the full details of how we simulate historical performance. Performance of Carbon Collective portfolios after 10/18/20 are simulated performance net of Carbon Collective’s fees and expenses of any underlying ETF included in the portfolios.
Simulated performance, nor past performance are a guarantee of future returns. Investments involve risks and there is always the potential of losing money when you invest in securities.
Total return:
Carbon Collective: 57.82%
Index: 35.95%
Jun 30, 2017 - Jun 30, 2022
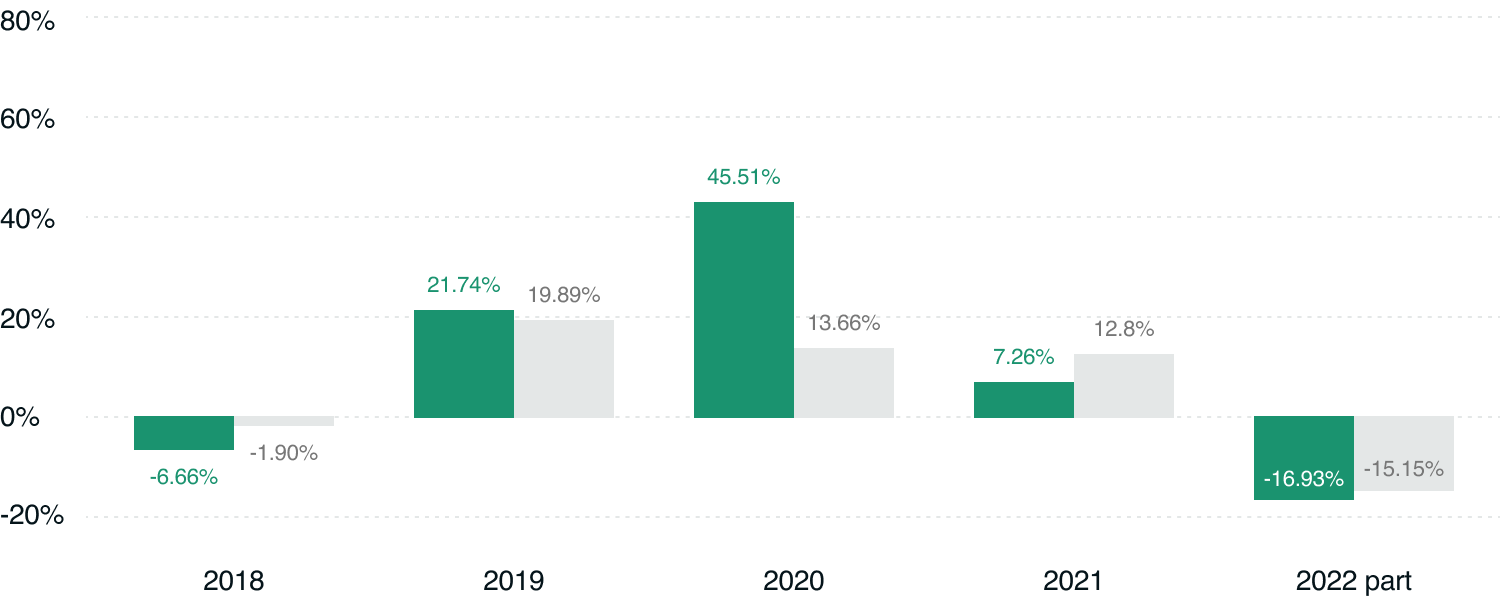

Disclosures
This data compares the selected Carbon Collective portfolio to the comparable blended US benchmark. For example, a 90% stock, 10% bond CC portfolio is compared to the 90/10 US stock/bond benchmark. Carbon Collective’s results include fees (0.25% annually) and assume reinvested dividends. The benchmark reflects a blend of the VTI and BND ETFs and therefore includes the actual expenses of those ETFs during the time period. Performance of all Carbon Collective portfolios from 01/01/2015 - 10/18/20 are backtested, rebalancing on the first day of each year as if our climate-forward strategy had been launched in 2015. See the full details of how we simulate historical performance. Performance of Carbon Collective portfolios after 10/18/20 are simulated performance net of Carbon Collective’s fees and expenses of any underlying ETF included in the portfolios.
Simulated performance, nor past performance are a guarantee of future returns. Investments involve risks and there is always the potential of losing money when you invest in securities.
Total return:
Carbon Collective: 83.93%
Index: 49.69%
Jun 30, 2017 - Jun 30, 2022
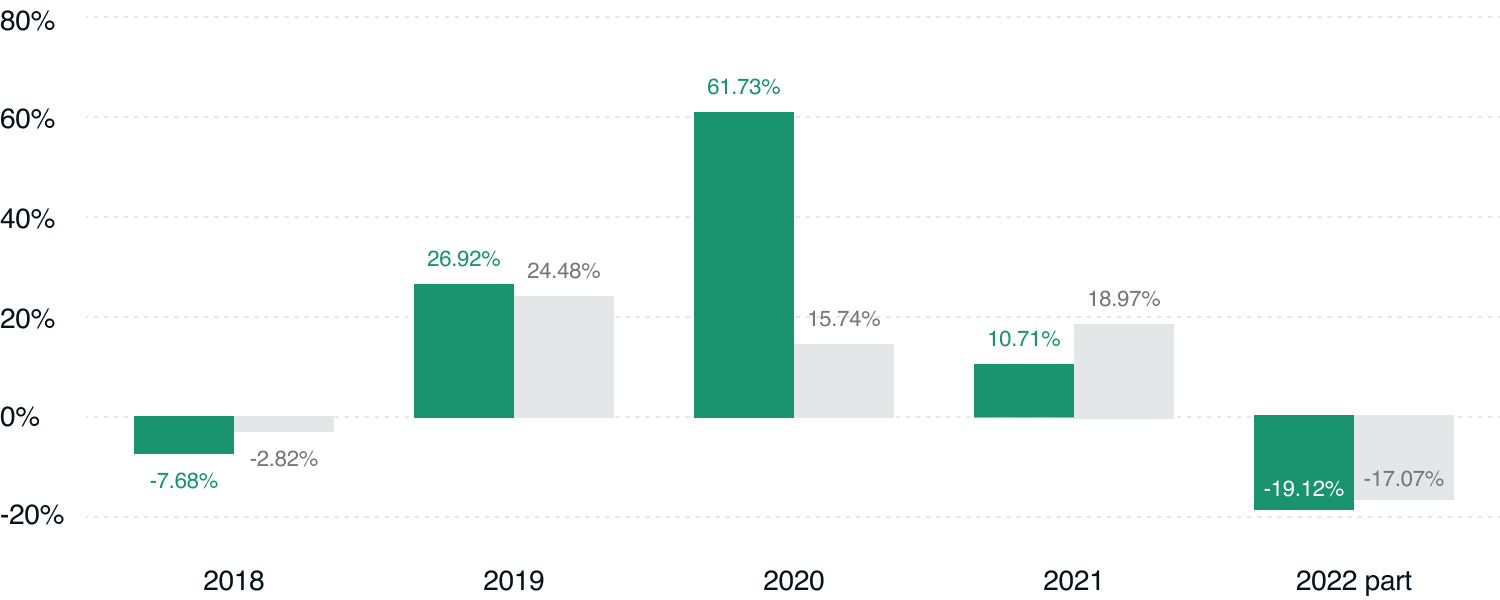

Disclosures
This data compares the selected Carbon Collective portfolio to the comparable blended US benchmark. For example, a 90% stock, 10% bond CC portfolio is compared to the 90/10 US stock/bond benchmark. Carbon Collective’s results include fees (0.25% annually) and assume reinvested dividends. The benchmark reflects a blend of the VTI and BND ETFs and therefore includes the actual expenses of those ETFs during the time period. Performance of all Carbon Collective portfolios from 01/01/2015 - 10/18/20 are backtested, rebalancing on the first day of each year as if our climate-forward strategy had been launched in 2015. See the full details of how we simulate historical performance. Performance of Carbon Collective portfolios after 10/18/20 are simulated performance net of Carbon Collective’s fees and expenses of any underlying ETF included in the portfolios.
Simulated performance, nor past performance are a guarantee of future returns. Investments involve risks and there is always the potential of losing money when you invest in securities.
Total return:
Carbon Collective: 70.15%
Index: 42.76%
Jun 30, 2017 - Jun 30, 2022
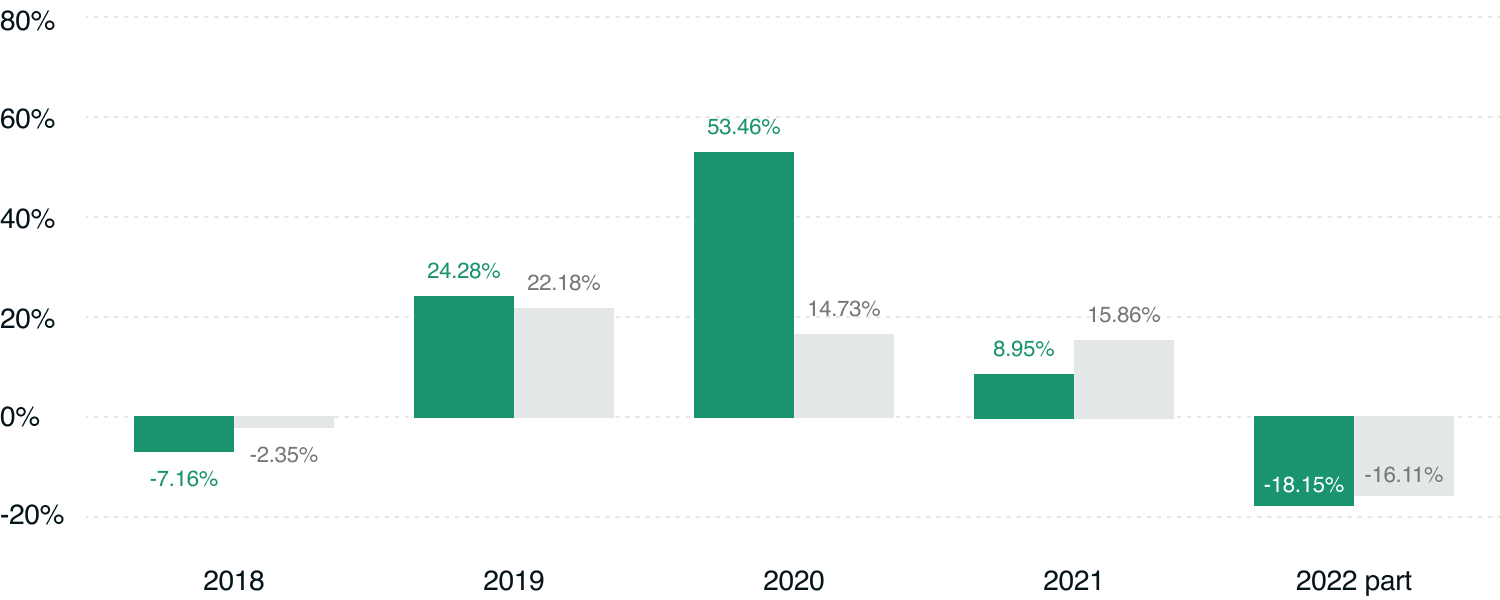

Disclosures
This data compares the selected Carbon Collective portfolio to the comparable blended US benchmark. For example, a 90% stock, 10% bond CC portfolio is compared to the 90/10 US stock/bond benchmark. Carbon Collective’s results include fees (0.25% annually) and assume reinvested dividends. The benchmark reflects a blend of the VTI and BND ETFs and therefore includes the actual expenses of those ETFs during the time period. Performance of all Carbon Collective portfolios from 01/01/2015 - 10/18/20 are backtested, rebalancing on the first day of each year as if our climate-forward strategy had been launched in 2015. See the full details of how we simulate historical performance. Performance of Carbon Collective portfolios after 10/18/20 are simulated performance net of Carbon Collective’s fees and expenses of any underlying ETF included in the portfolios.
Simulated performance, nor past performance are a guarantee of future returns. Investments involve risks and there is always the potential of losing money when you invest in securities.
Total return:
Carbon Collective: 44.86%
Index: 29.29%
Jun 30, 2017 - Jun 30, 2022

Disclosures
This data compares the selected Carbon Collective portfolio to the comparable blended US benchmark. For example, a 90% stock, 10% bond CC portfolio is compared to the 90/10 US stock/bond benchmark. Carbon Collective’s results include fees (0.25% annually) and assume reinvested dividends. The benchmark reflects a blend of the VTI and BND ETFs and therefore includes the actual expenses of those ETFs during the time period. Performance of all Carbon Collective portfolios from 01/01/2015 - 10/18/20 are backtested, rebalancing on the first day of each year as if our climate-forward strategy had been launched in 2015. See the full details of how we simulate historical performance. Performance of Carbon Collective portfolios after 10/18/20 are simulated performance net of Carbon Collective’s fees and expenses of any underlying ETF included in the portfolios.
Simulated performance, nor past performance are a guarantee of future returns. Investments involve risks and there is always the potential of losing money when you invest in securities.
Total return:
Carbon Collective: 109.57%
Index: 63.89%
Jun 30, 2017 - Jun 30, 2022

Disclosures
This data compares the selected Carbon Collective portfolio to the comparable blended US benchmark. For example, a 90% stock, 10% bond CC portfolio is compared to the 90/10 US stock/bond benchmark. Carbon Collective’s results include fees (0.25% annually) and assume reinvested dividends. The benchmark reflects a blend of the VTI and BND ETFs and therefore includes the actual expenses of those ETFs during the time period. Performance of all Carbon Collective portfolios from 01/01/2015 - 10/18/20 are backtested, rebalancing on the first day of each year as if our climate-forward strategy had been launched in 2015. See the full details of how we simulate historical performance. Performance of Carbon Collective portfolios after 10/18/20 are simulated performance net of Carbon Collective’s fees and expenses of any underlying ETF included in the portfolios.
Simulated performance, nor past performance are a guarantee of future returns. Investments involve risks and there is always the potential of losing money when you invest in securities.
Jun 30, 2017 - Jun 30, 2022
BENCHMARK
Risk (STD)
17.70%
13.80%
Max Drawdown
-29.90%
-27.80%
Recovery (Days)
77
134
Current Yield
1.48%
-
Annual Return
14.49%
9.39%
Beta
0.88
0.81
Alpha
4.34%
-0.14%

Disclosures
This data compares the selected Carbon Collective portfolio to the comparable blended US benchmark. For example, a 90% stock, 10% bond CC portfolio is compared to the 90/10 US stock/bond benchmark. Carbon Collective’s results include fees (0.25% annually) and assume reinvested dividends. The benchmark reflects a blend of the VTI and BND ETFs and therefore includes the actual expenses of those ETFs during the time period. Performance of all Carbon Collective portfolios from 01/01/2015 - 10/18/20 are backtested, rebalancing on the first day of each year as if our climate-forward strategy had been launched in 2015. See the full details of how we simulate historical performance. Performance of Carbon Collective portfolios after 10/18/20 are simulated performance net of Carbon Collective’s fees and expenses of any underlying ETF included in the portfolios.
Simulated performance, nor past performance are a guarantee of future returns. Investments involve risks and there is always the potential of losing money when you invest in securities.
Jun 30, 2017 - Jun 30, 2022
BENCHMARK
Beta
0.6
0.53
Alpha
2.19%
-0.34%
Max Drawdown
-22.40%
-18.30%
Current Yield
1.69%
-
Annual Return
9.54%
6.33%
Risk (STD)
12.20%
9.10%
Recovery (Days)
-
77

Disclosures
This data compares the selected Carbon Collective portfolio to the comparable blended US benchmark. For example, a 90% stock, 10% bond CC portfolio is compared to the 90/10 US stock/bond benchmark. Carbon Collective’s results include fees (0.25% annually) and assume reinvested dividends. The benchmark reflects a blend of the VTI and BND ETFs and therefore includes the actual expenses of those ETFs during the time period. Performance of all Carbon Collective portfolios from 01/01/2015 - 10/18/20 are backtested, rebalancing on the first day of each year as if our climate-forward strategy had been launched in 2015. See the full details of how we simulate historical performance. Performance of Carbon Collective portfolios after 10/18/20 are simulated performance net of Carbon Collective’s fees and expenses of any underlying ETF included in the portfolios.
Simulated performance, nor past performance are a guarantee of future returns. Investments involve risks and there is always the potential of losing money when you invest in securities.
Jun 30, 2017 - Jun 30, 2022
BENCHMARK
Annual Return
12.95%
8.39%
Risk (STD)
15.80%
12.20%
Max Drawdown
-26.90%
-24.70%
Recovery (Days)
77
121
Current Yield
1.55%
-
Beta
0.78
0.72
Alpha
3.71%
-0.21%

Disclosures
This data compares the selected Carbon Collective portfolio to the comparable blended US benchmark. For example, a 90% stock, 10% bond CC portfolio is compared to the 90/10 US stock/bond benchmark. Carbon Collective’s results include fees (0.25% annually) and assume reinvested dividends. The benchmark reflects a blend of the VTI and BND ETFs and therefore includes the actual expenses of those ETFs during the time period. Performance of all Carbon Collective portfolios from 01/01/2015 - 10/18/20 are backtested, rebalancing on the first day of each year as if our climate-forward strategy had been launched in 2015. See the full details of how we simulate historical performance. Performance of Carbon Collective portfolios after 10/18/20 are simulated performance net of Carbon Collective’s fees and expenses of any underlying ETF included in the portfolios.
Simulated performance, nor past performance are a guarantee of future returns. Investments involve risks and there is always the potential of losing money when you invest in securities.
Jun 30, 2017 - Jun 30, 2022
BENCHMARK
Risk (STD)
14.00%
10.60%
Beta
0.69
0.62
Max Drawdown
-24.40%
-21.50%
Recovery (Days)
-
119
Annual Return
11.20%
7.37%
Alpha
2.90%
-0.28%
Current Yield
1.62%
-

Disclosures
This data compares the selected Carbon Collective portfolio to the comparable blended US benchmark. For example, a 90% stock, 10% bond CC portfolio is compared to the 90/10 US stock/bond benchmark. Carbon Collective’s results include fees (0.25% annually) and assume reinvested dividends. The benchmark reflects a blend of the VTI and BND ETFs and therefore includes the actual expenses of those ETFs during the time period. Performance of all Carbon Collective portfolios from 01/01/2015 - 10/18/20 are backtested, rebalancing on the first day of each year as if our climate-forward strategy had been launched in 2015. See the full details of how we simulate historical performance. Performance of Carbon Collective portfolios after 10/18/20 are simulated performance net of Carbon Collective’s fees and expenses of any underlying ETF included in the portfolios.
Simulated performance, nor past performance are a guarantee of future returns. Investments involve risks and there is always the potential of losing money when you invest in securities.
Jun 30, 2017 - Jun 30, 2022
BENCHMARK
Annual Return
7.68%
5.27%
Risk (STD)
10.30%
7.70%
Beta
0.5
0.43
Alpha
1.36%
-0.41%
Max Drawdown
-20.30%
-16.10%
Current Yield
1.74%
-
Recovery (Days)
-
-

Disclosures
This data compares the selected Carbon Collective portfolio to the comparable blended US benchmark. For example, a 90% stock, 10% bond CC portfolio is compared to the 90/10 US stock/bond benchmark. Carbon Collective’s results include fees (0.25% annually) and assume reinvested dividends. The benchmark reflects a blend of the VTI and BND ETFs and therefore includes the actual expenses of those ETFs during the time period. Performance of all Carbon Collective portfolios from 01/01/2015 - 10/18/20 are backtested, rebalancing on the first day of each year as if our climate-forward strategy had been launched in 2015. See the full details of how we simulate historical performance. Performance of Carbon Collective portfolios after 10/18/20 are simulated performance net of Carbon Collective’s fees and expenses of any underlying ETF included in the portfolios.
Simulated performance, nor past performance are a guarantee of future returns. Investments involve risks and there is always the potential of losing money when you invest in securities.
Jun 30, 2017 - Jun 30, 2022
BENCHMARK
Risk (STD)
19.70%
15.30%
Beta
0.98
0.91
Alpha
4.87%
-0.07%
Recovery (Days)
77
136
Current Yield
1.40%
-
Annual Return
15.93%
10.37%
Max Drawdown
-32.90%
-30.80%

Disclosures
This data compares the selected Carbon Collective portfolio to the comparable blended US benchmark. For example, a 90% stock, 10% bond CC portfolio is compared to the 90/10 US stock/bond benchmark. Carbon Collective’s results include fees (0.25% annually) and assume reinvested dividends. The benchmark reflects a blend of the VTI and BND ETFs and therefore includes the actual expenses of those ETFs during the time period. Performance of all Carbon Collective portfolios from 01/01/2015 - 10/18/20 are backtested, rebalancing on the first day of each year as if our climate-forward strategy had been launched in 2015. See the full details of how we simulate historical performance. Performance of Carbon Collective portfolios after 10/18/20 are simulated performance net of Carbon Collective’s fees and expenses of any underlying ETF included in the portfolios.
Simulated performance, nor past performance are a guarantee of future returns. Investments involve risks and there is always the potential of losing money when you invest in securities.
Overview:
Our Climate Solutions Collection of stocks contains our filtered list of every company building solutions to climate change traded on US stock markets. This 2022-2023 update took over 1,000 hours of research, writing, and analysis to compile.
We began with an inclusionary ethical filter, finding every publicly traded company that is building a climate change solution listed in Project Drawdown or the IEA’s Net Zero 2050 Report.
Next, we applied an exclusionary filter, removing any company that did not generate at least half of its revenue from climate solutions. We also removed companies that have been credibly accused of fraud. For some sectors, we passed companies through a set of stricter inclusion criteria, specifically: utilities, yieldcos, waste management, biofuels, carbon capture, water distribution, LEDs, and reproductive health companies.
Finally, we passed the remaining companies through a simple financial filter. The remaining companies get weighted based on their current market caps with a ceiling of 5% of the total index. A company must have IPO’d at least six months prior to an update for us to include it on this list.
You can learn more about our ETF: Carbon Collective US Climate Solutions ETF
Jump to:
- Inclusionary filter: All companies building Drawdown solutions
- Exclusionary filter: Remove all companies who generate more revenue from the fossil fuel industry
- Refine: Specific criteria for utilities, waste management, and more
- Financial filter: Weight by market capitalization
- Annual update criteria
- Notable companies that were excluded
Step 1: Inclusionary filter.
Find every publicly traded company building a climate solution.
We build the Climate Solutions Collection and include it in our portfolios because we cannot solve climate change by simply divesting from “bad” companies. We also need to significantly increase investments in solutions.
According to the Climate Policy Institute, we globally invested ~$632 billion into climate solutions in 2020. That is good but far from enough. To be on track to avoid catastrophic warming, we need to be investing 5-8x more, ending up with over $5 trillion in annual climate investments by 2030.
We need to install a lot of solar panels. And electrify a lot of buildings. And change over to a lot of electric cars. All of that takes investment. And until we built this collection, we could not find any way to invest in those companies building solutions to climate change.
More companies every day are building the climate solutions found in Project Drawdown.
There is no single solution to climate change. From now until 2050, we must dramatically transform our global infrastructure to run without fossil fuels while preserving and protecting as many natural ecosystems as possible. Luckily, more and more companies are stepping up to build these critical solutions. The first part of building the Climate Solutions Collection is to aggregate all of them that are trading on US public stock exchanges: large and small, pure-play and conglomerate.
It’s more than just solar and wind companies.
When people think of companies building climate solutions, the first thing that often comes to mind is renewable energy. That’s because we’re going to need to transition our entire global electrical system to running without emitting carbon dioxide. Most of this transition will need to happen from 2020 - 2030.
But to solve climate change and remain below 1.5ºC of global warming, humanity must implement far more solutions than just clean energy. We need our global fleet of buildings to be energy retrofitted, our electrical grid infrastructure to be significantly expanded and reinforced, our cars and trucks to run on electricity and green hydrogen, and much more. This is why we use comprehensive frameworks like those built by Project Drawdown and the International Energy Agency. They present clear paths on how we solve climate change.
Step 2: Exclusionary filter.
Remove the companies that generate less than 50% of their revenue from climate solutions
Just because a company is building a Drawdown solution does not mean that they are oriented toward solving climate change. In our second step of building the Climate Index, we dig into each company to analyze the extent to which they are supporting the transition to a zero-carbon world.
Separate out the “pure-play” companies.
First, we make it easy on ourselves by separating out the “pure-play” companies. If a company is just manufacturing solar panels or selling electric cars, we label them pure-play and include them in the index. After this is done, what remains are the companies that have multiple product lines and sources of revenue. For these, we dig further into the numbers.
Look closer at the companies that make products/services for many industries.
For these remaining companies, we dig into their financials to find the answers to the following questions:
- What % of their revenue comes from their main climate solution product
- Do they also build other climate solutions?
- Do they make at least 50% of their revenue from those products/services?
We only use the past year's revenue in this calculation. We do not take stock of any future projects around climate commitments as actions are far more powerful than words.
For some companies, their revenue reporting was not detailed enough to make a clear distinction. These companies are excluded from the collection, using the 'Lacks Proper Information' tag.
One note: Many companies sell a given product line to multiple industries and can include oil and gas. For example, an LED lighting manufacturer makes industrial lighting. Some of its customers own warehouses, some are from the fossil fuel industry. Outside of military applications, we do not discriminate based upon who a company is selling its climate solutions to. It only matters how much of their revenue comes from those solutions. Even fossil fuel companies are installing solar panels on their offices.
Exclude the companies that make less than half of their revenue from climate solutions companies.
Finally, we remove any company that did not meet the threshold of generating at least 50% of their revenue from climate solutions. We use revenue as the leading metric for exclusion because greenwashing is a reality in this space. Many companies want to appear as if they are aligned with solving climate change while, in actuality, taking little meaningful action. A 50% revenue threshold differentiates between the companies that are committed to building solutions and those simply dabbling in it. Such a target also gives the opportunity for those dabbling to be included in future updates as they increase their revenue from climate solutions.
Also, at this stage, we also remove any companies who have been credibly accused of committing fraud. There are companies out there that are capitalizing on the global rush to build climate solutions. Those that have been caught making clearly fraudulent claims will also be removed at this stage.
Step 3: Refine.
A number of sub-sectors need more specific criteria.
Some categories of companies are harder to classify and need more specific criteria. For each of these, we pass the companies through additional exclusionary filters specific to their industries.
Criteria for a “green utility” and yieldcos
There are dozens of investor-owned utilities traded on the New York stock exchange (such as Duke, NextEra, Dominion, Xcel, PG&E, etc.). While practically all of them have some form of carbon reduction/neutrality commitment, there is a broad range of historical investments in renewable energy and follow-through on these commitments.
In order to be included in the Climate Solutions Collection, an investor-owned utility must meet some very strict criteria:
- Generate 100% of its energy from carbon neutral sources (wind, solar, hydro, and nuclear).
- 100% of the electricity they transmit is from carbon neutral sources (wind, solar, hydro, and nuclear).
- They cannot generate any revenue from the sale of natural gas.
We are excited for the day we get to add truly green investor-owned utilities to this collection.
Given that Yieldcos operate similarly to utilities in that they make money from generating electricity, we process them through the “green utility” exclusionary filter, as well.
Criteria for waste management companies
There are three Drawdown solutions related to waste management: recycling, composting, and landfill methane capture. All of the publicly traded waste management companies collect materials for recycling. Municipalities, not waste management companies, decide to collect compost. Therefore, we opted to use landfill methane capture as the deciding factor. In order to be included in the Climate Solutions Collection, a waste management company must capture methane at over 50% of the landfills it operates.
Criteria for biofuel companies
Biofuels are combustible fuels that can be used in internal combustion or jet engines but are not derived from fossil fuels. Instead, they are produced from fermenting biological matter. While burning them does release emissions, biofuels can emit far less, and more importantly, they can exist as part of the natural carbon cycle of annual uptake and release instead of emitting previously sequestered carbon. Most biofuels, though, are not necessarily better for climate, at least not yet. Mostly ethanol-based fuels are mixed with gasoline; the emissions reductions from these are fairly marginal.
Advanced biofuels, on the other hand, are made primarily of crop waste/and “used cooking oils” offer a complete drop in replacement for fossil fuels and can offer significant emissions reductions. For a biofuels company to be included in the Climate Solutions Collection, advanced biofuels must make up more than 50% of its biofuel production.
Criteria for carbon capture & sequestration companies
For humanity to truly solve climate change, it will need to capture historic atmospheric carbon emissions and secure them in some form. There are many methods of doing this, but one is to separate CO2 from the air and sequester it as a gas underground or in other secure places. Up and coming, non-public companies like Climeworks are working to scale such technologies for ambient air. There are a number of publicly traded companies that provide carbon capture services, but for a different industry: fossil fuels. Companies like Fuel Cell and Babcock & Wilcox generate a significant amount of their revenue from generating “blue hydrogen” by separating hydrogen and carbon from methane (natural gas).
We classify revenue from such activities as “fossil fuel revenue” for two reasons.
- There have been no at-scale demonstrations of any company’s ability to sequester such captured CO2 from fossil fuels despite significant investments in it.
- This lack of viable sequestration has led to significant greenwashing, enabling fossil fuel companies to paint themselves as part of the clean energy transition without taking real steps to curb emissions from their products.
For a company to be included in this sector, it must generate more revenue from a Drawdown solution that does not serve the fossil fuel industry than the revenue it generates from generating blue hydrogen for the fossil fuel industry.
Criteria for water companies and water utilities
Water conservation and moving water more efficiently are important climate solutions. There are many companies in the water industry, from monitoring to treatment to distribution, but not all are helping advance climate solutions related to water. So, to be included, a water company must generate at least 50% of its revenue from the following activities:
- Create and/or deploy technology that detects leaks
- Improve energy efficiencies for transporting water (pumps, etc.)
- Create and/or deploy water recycling technologies
Criteria for plant-based diet companies
Plant-based foods can create the same number of calories with far fewer emissions than those produced from animals (with some rare exceptions). So which companies should be included in the Climate Solutions Collection? Beyond Meat seems obvious, but what about Dole? They make the vast majority of their revenue from selling canned plant-based foods (beans, pineapples, etc.).
In order to qualify for the climate index, a plant-based food company must only sell plant-based products and must be accelerating the adoption of plant-based foods. They need to offer some kind of replacement or expansion of the menu to make it easier to switch, not just provide the raw ingredients for it. We also exclude a company in this section that generates revenue from selling flavor enhancers to cigarette companies. They make other plant-based foods as well, but this fails our consumer staples tobacco filter.
Criteria for LED companies
LEDs are an important climate solution. They enable us to do the same thing (create light) with significantly less electricity than incandescent or fluorescent. But not all LEDs are used for lighting. LED components are used in the screen for your smartphone, computer, TV, and even stadium "jumbo-tron." To be added into the Climate Solutions Collection, an LED company must generate over half of its revenue from lighting products that replace existing energy-intensive options (or other climate solutions).
Criteria for reproductive health companies
Many companies make reproductive health products, so who should be considered in the climate index? Should Arm & Hammer, the owners of Trojan condoms, get in? We define this category more narrowly. For a company to be considered, it must generate at least 50% of its revenue from its reproductive health and contraception products.
Criteria for defense filter
Many companies build products that are used in the defense industry. We exclude those that sell a product to the defense industry that is not in a Drawdown solution category.
For example: CREE makes LED lighting, a Drawdown solution. They also make products used in RF communication (not a Climate solution) which are used for military communications. Therefore CREE is excluded from the 2023 Climate Solutions Collection.
Criteria for telepresence
Many companies are engaged in making virtual work and telepresence possible, from the internet provider to your email platform.
To be included in the Climate Solutions Collection, a company must generate at least 50% of its revenue from activities that replace a physical task that historically has required travel (going to the office, a meeting, signing a document, etc.) with something digital (video meetings, teleconferences, e-signatures).
For example: 100% of Zoom and DocuSign's revenue comes from products that enable work to be done virtually that previously would have required physically moving people and things.
Criteria for critical mineral companies
In 2020, humans extracted 7,575 Mt of coal from the ground and then burned it (Source: IEA)
In 2020, humans extracted ~7.5 Mt of critical minerals for clean energy/EV’s. like cobalt, copper, and lithium (Source: IEA)
By 2040, humans must be extracting ~45 Mt of critical minerals annually to be on track to transitioning away from coal and electrifying everything.
There are not enough copper, lithium, nickel, cobalt, graphite, and other rare earth elements above ground today to transition to 100% carbon-free electricity and electrify everything at the same time.
While any mining and resource extraction is environmentally destructive and unsustainable in the long term, there is no way around it to achieve the more pressing near-term goal of avoiding catastrophic warming. Therefore we include companies that generate >50% of their revenue from mining critical materials. We exclude any of these companies that have a credible human rights or environmental complaint lodged against them.
The IEA estimates that by 2040, recycling already extracted-critical materials could meet up to 10% of global demand. The advantage of critical material mining is that the material is above ground, and it can be recycled and reused almost indefinitely. Meaning there is a theoretical point where we have “enough” mined materials and do not need more circulating in the economy.
Step 4:
Apply a financial filter, then weigh by market cap.
The final step of creating the Climate Solutions Collection is to apply a light financial filter. Using our Smart Investing 101 principles, we want to invest broadly across sectors without picking winners and losers. Therefore, we don’t exclude companies on a financial basis outside of a few broad rules:
A company must be traded on the New York Stock Exchange.
The New York Stock Exchange, Nasdaq, Amex, and/or CBOE. No pink slips or over-the-counter companies.
It must have IPO’d at least six months earlier.
The first six months of a company’s journey on public markets can be quite volatile. After six months is when employees can generally sell their stock, so we wait until this point for a company to be able to be included in the Climate Solutions Collection.
It cannot be a SPAC.
The Climate Solutions Collection invests in companies solving climate change, not Special Purpose Acquisition Companies that will wait to take such companies public.
Then, we weight the remaining companies by market cap.
For the remaining companies, we simply let the market decide how much of the Climate Solutions Collection they should get. We add up all of the market capitalizations of each company (share value * number of shares) to get the total market capitalization of the climate index. From here, we divide the market cap of each company by the total to get what % of the Climate Solutions Collection the given company should be allocated.
Then we add a ceiling of 5.00%. We add this ceiling because we don’t want any company to take up too much of the Climate Solutions Collection (ahem, Tesla).
Step 5: Update annually.
It seems like new companies building climate solutions are coming onto the market every day. How often do we update the Climate Solutions Collection? For now, we update it annually, just like we do with our Core portfolios.
The Carbon Collective US Climate Solutions ETF may get updated more regularly.
Some notable companies that didn’t make it
f you look through the Drawdown list of climate solutions, you will find some solutions that don’t have companies associated with them in the Climate Solutions Collection. These publicly traded companies made it through the first inclusionary filter but not the second exclusionary. We hope this changes over time as companies increase the revenue they generate from these divisions. These solutions are exciting, and we personally are excited to invest in them. Here are some examples of categories we’re excited to include in the future:
Alternative refrigerants
Chemours and Honeywell are both working on alternatives to freon and other highly polluting refrigerants, but the majority of their refrigerant revenue still comes from the old, polluting variety.
Hybrid cars
All traditional car companies still make a majority of their revenue from selling non-hybrid, fossil fuel-burning cars. We could not find a traditional car company that met the criteria for inclusion. The closest was Toyota which sold 15 million hybrid vehicles between 1997 and 2020. This is impressive, but Toyota sold 10.6 million vehicles in 2019 alone.
Bicycle infrastructure
Uber and Lyft both own urban bike sharing companies and “last mile” electric scooter companies that help people in cities quickly go short distances without using cars. The problem is that Uber and Lyft’s core businesses do the opposite from a climate perspective. In 2020, the Union of Concerned Scientists published a report claiming that the two companies ride-sharing systems generate 69% more pollution than the transportation they replace.
How to Invest in Climate Solutions Stocks
Carbon Collective @ Home: Have a retirement account or some cash you are looking to invest in comprehensive, climate-focused portfolios? We help hundreds of individuals and families with their investments on our personal investing platform.
Carbon Collective @ Work: Looking to get green and climate-focused portfolios in your 401(k) at work? We help dozens of businesses, startups, and non-profits align their 401(k) portfolio offerings with their mission. Learn more about our Green 401(k) Program.
ETF: Have a retirement or brokerage account elsewhere that you want to add Climate Solutions to? Our Carbon Collective US Climate Solutions ETF is accessible on (basically) all major trading platforms.
Want to learn more about sustainable investing? Check out the Ultimate Guide to Sustainable Investing.
Invest in the World You Want to Retire Into
And, if you have questions, we're real people, ready to help.
Watch the Webinar
Watch the on-demand Sustainable Investing 101 webinar! Learn how to be a smart investor who cares about climate change.
Watch NowGet Our Newsletter
Go a level deeper with us and investigate the potential impacts of climate change on investments like your retirement account.
Join NewsletterTalk To A Human
Joining a new investment service can be intimidating. We’re here for you. Click below to email us a question or book a quick call.
Ask a Question
.jpg)
.png)

.jpg)


.jpg)


.png)
.png)
.png)
.jpg)
.jpg)

.jpg)


.png)


.png)

.jpg)
.jpg)

.png)
%20Logo.png)

.jpg)


%20Logo.jpg)
.jpg)
%20Logo.png)




.png)


.jpg)
.png)


.png)


.png)
.png)
.jpg)
.png)
.jpg)
.png)

%20Logo.png)
-1.png)

.png)


.png)
.png)
.jpg)
.png)
.jpg)



.jpg)
.png)

.png)


.png)
